Professional traders have long known that when trading binary options it is preferable to use a third-party live chart, for example, from the service TradingView, rather than brokerage. The binary options industry is only at the beginning of its development, and brokerage platforms lag far behind Forex terminals and specialized graphic services. Leading binary companies have already created terminals with various types of charts, with the ability to plot graphically and a small set of indicators. But they are all inferior to the best live chart for any trader - TradingView.
Tradingview official website –
Advantages of Tradingview chart over a regular broker platform
The Tradingview graphical service compares favorably with broker terminals with many useful functions:
- a wide variety of chart types;
- you can view the history of quotes for any past period;
- any graphic constructions;
- excellent scalability of charts - it’s easy to see the general trend at any intervals;
- a huge number of the most popular indicators and the ability to develop your own.
Everything described above is usually not available on broker platforms, and there are usually several indicators and they work less clearly.
Charts at the broker or in the trading terminal?
You can track the movement of an asset’s price in several ways, each of which has its own advantages:
- On the broker's website. Often the charts of brokerage companies are not functional enough and limit the actions of the trader. But there is no need to open several windows and monitor the chart at the same time;
- Trading terminals Meta Trader 4 and 5. The most functional tool that allows you to analyze an asset inside and out, and only after that make a deal. You can download additional indicators, create templates, and test strategies. The disadvantage is that Meta Trader requires installation on your computer. And since binary brokers do not offer terminals for downloading, you will first have to register on the website of some forex company, for example, with the Alpari broker, which, in addition to forex, also offers binary trading;
- Live binary options charts in real time. In terms of functionality, they are only slightly inferior to the MT4 and 5 terminals, but are many times superior to the trading platforms of any broker. And you’ll find out what exactly it is very soon, because next we’ll look at the main features that make binary options charts better.
TradingView Versions and Registration
You can use several versions of Tradingview that are convenient for you:
- Convenient live schedule on our website
- English full version tradingview
- Tradingview com in Russian
We recommend choosing the English version of Tradingview over the Russian one, since the English community of traders is much larger and there are many more interesting ideas there.
When registering on the Tradingview website (you only need to enter your email and password), additional program features open up:
- All chart settings and graphical constructions on them and inscriptions will be saved.
- It will be possible to use more indicators and scripts.
- It will be possible to program warning signals for certain events.
- Trading ideas from traders around the world.
- You can save ready-made templates for charts.
- Collective and private chats of traders.
To register for TradingView on the official website, click “JOIN FOR FREE”:
Next, if you do not need a paid subscription, enter your email, desired username and password and click the “Sign UP” button:
Registration on Tradingview
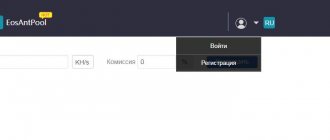
To begin the registration process on the site, you must click on the blue “REGISTRATION” button, which is located in the upper right corner of the site. After this, fill in all the required information:
- Username;
- e-mail;
- password.
Then check the box, complete the captcha and click “Register”.
After this, you will be taken to your personal exchange account.
There are 2 versions of use available on Tradingwiev - free and paid (PRO). Paid subscription prices range from $9.95 to $39.95 per month.
Each of these subscriptions can be tested with 30 days of free use. To proceed to registration, click on the “Become a PRO” button in the site menu and follow the instructions.
Let us immediately note that in order to receive a paid subscription test, you must provide payment card information.
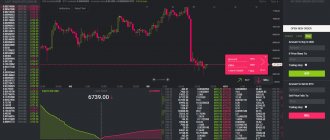
TradingView com top toolbar
1. Here we select the chart asset - any currency pairs, indices, stocks
To select an asset, simply enter its name, for example EURUSD (dollar exchange rate against the euro) or GOLD (gold). You will be offered several quotes from different providers: FXCM, IDC, BTCE... Choose FXCM quotes as the most accurate from the prime broker.
2. Set the chart timeframe - the time during which one bar or chart candle will be formed. For example, if you choose a time frame of 5 minutes, each candle or bar will correspond to a price change within 5 minutes.
3. Connect the indicators.
The most popular indicators are in the Built-Ins . Public Library folder contains indicators written by professional traders (the platform has such a function for creating an indicator), they are arranged by popularity. The more popular the indicator, the higher it is in the list.
4. Comparison of graphs.
This tool is necessary to determine the similarity of several graphs to each other. Let's look, for example, at how the EUR\USD and GBP\USD currency pairs correlate with each other. Click on the comparison tool, then type GBPUSD.
The following picture emerges:
5. Select the type of chart. Tradingview has as many as 10 types of charts to choose from:
- Japanese candlesticks are the most popular among traders;
- Bars;
- Empty candles;
- Heiken Ashi - show the current trend;
- Line;
- Renko;
- Region;
- Linear breakthrough;
- Kagi;
- Tic-tac-toe.
Live graph display
By default, TradingView charts are displayed as Japanese candlesticks. This element is most often used by traders around the world, but the platform’s capabilities are not limited to this.
In order to change the visual display, you need to click on the arrow next to several proposed options. The choice will amaze even experienced traders:
- Bars (American candles).
- Empty candles.
- Heiken Ashi.
- Line.
- Region.
- Renko.
- Kagi.
- Tic Tac Toe.
It is worth noting that such variety, as well as the number of time frames, is found only in the live chart for binary options. Even the MT platform has more limited functionality, and in order to use, for example, the Renko chart there, you will have to download separate files and carry out rather complex manipulations to install them.
Of course, many traders never use such a rare display, however, each of them has its advantages. For example, the Renko chart is not time-bound and displays only the current market situation.
Left panel of graphical constructions.
Now let’s look at the left panel, which contains a huge number of useful tools:
- Choose a convenient cursor type in the form of an arrow, dot or cross.
- The trader's most important tool is the line.
- Complex graphical elements: Gann fans, Fibonacci corrections, spirals, wedges and others.
- A variety of standard shapes: arc, triangle, square, ellipse, etc.
- Adding text.
- Pattern drawing – triangles, time cycles, ABCD pattern
- Possibility of calculating risks for transactions and predicting the result
- Information icons
- Zooming in on a specific area of the graph
- Using Additional Information
- Magnet function
Using graphical constructions, you can draw support or resistance lines, channels, trend lines - the most important elements of technical analysis.
Live chart graphic elements
On a live chart, graphical elements are a very important technical analysis tool. Here we mean various shapes, arrows and lines. This functionality in online platforms is often limited to horizontal and vertical lines. In addition to them, TradingView has equidistant channels and figures.
Increase
There are always 6 elements, but this is just the tip of the iceberg. When you hover over any panel symbol, an additional window will open.
Increase
It can be easy to get confused in the huge amount of graphics, so they are divided into appropriate categories:
- Ranges. Horizontal or vertical ranges, which are marked as time periods, and levels of resistance or support.
- Templates. Ready-made images of different patterns. They can be placed on the chart according to the current cost pattern.
- Text. Various footnotes, comments, letter symbols.
- Brush. The ability to draw an arbitrary element on the chart.
- Pitchfork. Dozens of different variations of Andrews pitchfork, equidistant channel.
- Trend lines. This includes lines, rays and angles.
All elements can not only be placed on a live graphic, but also colored at your own discretion. This is very convenient in cases where several types of graphics are used at once.
Publishing your own ideas is a distinctive feature of the service
Tradingview com is not only the most convenient live chart, but also a popular social network for traders around the world. Each participant has the right to publish his trading forecast on the chart and others will see it. For example, the forecast looks like this:
Here, trader Moshbi predicts a fall in the AUD\USD pair in the near future. In the comments to the forecast, other participants share their opinions, give advice, and give “likes” if they trust the forecast. You can choose a trader with accurate forecasting methods and copy his trades.
There is a special article on our website that reveals all the intricacies of social trading, “ Copying trades on binary options .”
How to open an account in TradingView?
If you would like to open a free account with TradingView, simply follow this link and click the "Register" button in the top right corner of the screen.
Join Free
Then all you have to do is enter your registration details and you are good to go.
A free TradingView account gives you the following features:
Access to charts and all indicators, 1 chart in one tab, 1 saved chart, 1 server-side alert, up to 3 indicators per chart, 1 indicator template, timeframes for screening: daily, weekly, monthly.
With a free account you will have to put up with advertising on the chart. It's not that big, but over time it starts to get boring. To get rid of it, you need to switch to any Pro account.
Is TradingView paid or free?
The TradingView service can be used completely free of charge, and the trader will have access to a huge functionality of the platform:
- Any system charts and their timeframes, the ability to save 5 charts
- News alerts
- Creating indicator templates
- Testing trading strategies
- Publishing your trading ideas
- View other people's ideas
- Ability to take notes on your transactions
You may never need the paid version of Tradingview - it will take several weeks or months to master the current functionality, and not everything will be useful. But if you become a serious speculator and pay for a paid subscription, the following opportunities will open up to you:
- The most accurate quotes from all world exchanges
- View real volumes for futures and stocks
- Advertising will no longer interfere
- Multiple charts on one screen
- Unlimited number of indicators on charts
- Faster graph data updates
- Saving any number of charts without restrictions
- Specific types of charts on time periods less than a day (“Renko”, “tic-tac-toe”, etc.)
- The owner of a premium account can take advantage of free technical support.
It is possible to use the Pro version of TradingView absolutely free for 30 days. After the time has expired, you can register a new account with a different email and work again in the professional version for 30 days. The only negative is that data from your previous account will not be transferred.
Currently, the Tradingview service provides the best charts and tools for professional traders with enormous functionality. TradingView has absorbed all the best from advanced brokerage terminals and is highly appreciated by market experts. And trading ideas from top speculators around the world are an exclusive feature of the service, helping to exchange experiences between novice traders and experienced specialists.
Working with the Tradingview live chart platform
There are several available ways to open a Tradingview chart:
- a simplified version of tradingview on this site;
- full version of the chart without registration on the tradingview website of the same name;
- improved version of the chart on TraderVader;
- Russian-language full version of the tradingview chart.
To obtain full optimal access to the entire list of existing platform capabilities, it is recommended to register. When using the simplified version of Tradingview, the efficiency is only 5% of the total TV capabilities.
Main advantages of the full version:
- You can save all changes and additions to the chart;
- the ability to save several types of charts, as well as templates;
- the presence of a large number of indicators and various scripts;
- presence of alerts;
- the ability to implement a variety of your own ideas and numerous ideas of traders;
- comparison and selection of different tools;
- availability of economic news, general and private chats.
To register, you need to go to the main website at the online address www.tradingview.com, and then use the Join for free button.
After scrolling, you will be taken to a new window (with an offer for a paid subscription), where there is a Sign Up button.
Using Tradingview
There are several ways to open the TV schedule:
- simplified version of tradingview on this site;
- full version without registration on the tradingview website itself;
- advanced version on TraderVader;
- full Russian version of tradingview.
To gain access to all the features of the platform, you need to register with it. Because the simplified version gives only 5% of what TV is capable of.
Main advantages of the full version:
- all artwork on the graphic can be saved;
- you can save several types of charts and their templates;
- An incredible number of indicators and scripts are available;
- there are alerts;
- your ideas and those of thousands of traders;
- comparison of different tools;
- economic news, general and private chats.
To register, you need to go to the main website at www.tradingview.com and click on the Join for free button.
Scroll down the new window (they offer a paid subscription) and simply find the Sign Up button.
Russian version
Not long ago, Tradingview became Russian-language, at ru.tradingview.com .
The Russian version has both its pros and cons.
The advantages are clear - the Russian language. Otherwise, I would say there are more disadvantages. In the English version:
- a colossal community of interesting traders with their ideas - there are very few of them in the Russian language;
- all popular indicators and scripts are written by Western traders;
- in the English version you have access to all the world's trading wisdom, in the Russian version you will find yourself in a kind of “pen” for those losers who do not know English.
Otherwise, their functionality is identical, it’s just that the Russian one has a much smaller crowd. Therefore, I describe the English version, because I continue to work with it.
If you chose Russian Tradingview, it’s okay, the interface and capabilities are similar. And learn English) The crumbs from the world's trading heritage are available in Russian.
Paid pro version of Tradingview
As you can see, in addition to free ones, there are several paid subscription options. What's interesting about them:
- the ability to use several charts in one window (multi-window);
- lack of sponsorship advertising;
- the ability to save an unlimited number of charts (only 5 in the free version);
- the ability to place an unlimited number of indicators on the chart (10 in the free version);
- 10 alerts;
- any timeframes for any assets;
- real-time data for many exchanges;
- Renko, Kagi, tic-tac-toe charts on timeframes less than a day;
- real volumes for stocks and futures.
You can experience the delights of the pro version yourself. To do this, in the registration window you need to click on the Start Free Trial button:
As a result, you will receive a free pro version for 30 days.
Hint - you can receive this version every 30 days, each time registering for a new email. But, of course, saved charts and instruments cannot be transferred.
Registration is simple: in the Sign Up window, enter everything you need. You can also register via Facebook/Twitter.
In the future, to get into the schedule, select Sign In, enter your name/password and get to the platform.