Here we will analyze investing.com signals , their advantages and disadvantages. This site offers signals to encourage traders to buy or sell. Accordingly, many people have a question about whether they should trust the information presented.
To begin with, we note that this portal began its existence back in 2007. In ten years, it has managed to attract a huge number of traders from all over the world, which is not surprising since it is presented in 18 languages. Additionally, we recommend reading our review about signals for binary options.
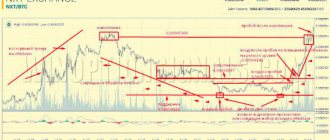
The portal publishes not only signals based on indicators, summary tables, but also a large amount of the latest news from financial markets around the world, and economic calendars. The information on the charts is generalized, and therefore not everyone agrees that it is called a signal. Investing com signals can be obtained through technical analysis in real time using a summary table.
You need to go to the investing.com portal, then select the Technical Analysis section on the top panel, then Summary Technical Analysis.
Signals investing.com, general information
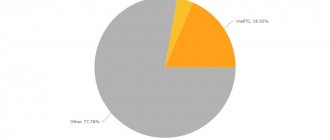
On investing.com, the signals are compiled into Summary Technical Analysis, which got its name because it uses aggregate data from moving averages and various options indicators.
Binary options brokers engaged in trading with the help of investments, and focusing on the advantages of the signals of this resource, called “signal”, imply a summary of a technical nature. Such signals are located on the technical analysis page and are located under the summary tables of indicators.
The following types of signals are distinguished on the site:
- Strong signals : these include Active Buy and Sell signals. In the first case, indicators indicate an increase in the chart and encourage active purchase of a call option. In the second, the charts, on the contrary, are lower for all indicators, and therefore you need to actively buy a put option.
- Weak signals : Buy and Sell. In the first case, only some indicators indicate growth in the chart, and buying is a call option. With the second signal, most indicators indicate a fall, so it is worth buying a put option.
- There is no signal only in the Neutral position of the indicators. In this case, you should refrain from trading.
By analyzing these signals, according to brokers involved in the sale of binary options on this site, you can get a successful transaction. They claim that online technical analysis is very effective and the indicators are set accurately.
Our recommended binary options brokers:
| Brokerage office | Min. deposit | Min. bid | Bonus | Demo account | License |
| Binomo | 10$ | 1$ | Up to 100% | Yes | TsROFR |
| FinMax | 100$ | 5$ | Up to 150% | Yes | TsROFR |
| Migesco | 5$ | 1$ | Up to 110% | Yes | TsROFR |
| Binarium | 9$ | 1$ | Up to 60% | Yes | TsROFR |
| 24option | 200$ | 24$ | Up to 100% | Yes | CySEC |
Traders' points of view on investment signals
Traders' opinions differ in many respects, and by reading reviews of signals, you can be convinced of this. The fact is that it is not entirely clear how the analyzer works. Based on what data are graphs and signals created? Site experts who provide specific tips receive payment for their work directly from those sites that are represented in the signal analyzer. How honest these signals are is up to you to decide.
You see a picture of binary options signals that has developed exclusively at the moment. You are not able to view statistics over a long period of operation of a particular options broker. All movements of the asset remain a mystery, and you cannot say with confidence that it is currently worth trading actively.
Beginners blindly buy binary options paying attention to indicators, and therefore, sooner or later the deposit is drained. A huge number of negative comments appear, which force many to wander around the Internet in search of the truth about signals. In most cases, in order not to bother, users call investing.com a scam and close the site page in disappointment.
This is the wrong reaction because investing can be as rewarding as a free options resource can be. In order to avoid failure, you just need to not be lazy and conduct your own summary analysis, creating signals for yourself. If you are a beginner, then first read thematic literature and articles about signals dedicated to binary options. It is better to read different reviews, form your own opinion based on them, and then trade. In this case, all the advice from investing.com will become much more useful, and you yourself will be able to determine where the lies are and where the truth is.
Basic principles of technical analysis
As mentioned earlier, technical market analysis is based on several axioms, and these are the ones that need to be considered now.
Price changes are the main and only way to obtain information
This basic principle states that the price, as well as the trading volume, already reflects all the necessary information to carry out a value analysis. Thus, the trader pays attention only to the dynamics of their ratio, which allows, in most cases, to effectively predict market changes in the future. The forecast in this case is not only simple, but also accurate and fast.
Price movement is not chaotic - it follows trends
The second axiom of technical analysis is the statement about certain trends in price changes and the absence of any randomness in this. For this reason, the time series of price changes is almost always divided into intervals where price changes occur in one direction.
It is for this reason that each chart is wavy, that is, it can trace both rises in value and its dips. Experts identify 3 key trends:
- downward (price fall);
- ascending (its growth);
- lateral (constancy of value).
Changes are repeated
The essence of this basic principle is that absolutely any event associated with a price change is repeated. From this it is easy to conclude that if you have such information about the past, you can easily predict any market events in the future. For example, if you are studying a market event, you can look for similar situations in the past and draw conclusions about how they ended.
It is this axiom that allowed traders to develop patterns, that is, typical chart designs that reflect current price behavior. Among the first such techniques was a chart called Japanese Candlesticks, which is widely believed to have been created by rice traders in Japan.
What about investing com?
It is worth noting that investing.com in Russian is quite convenient. The investing interface is aimed at the visitor’s comfort; it is quite simple and allows you to quickly find the information you need. This resource may be useful, but only for experienced traders. Those who want to find already chewed information of high quality there will definitely be disappointed. This applies not only to investing.com, but also to other platforms. Investing actually provides a lot of useful information, including market news. In order for trading to go better, study this subject in detail and think logically about every step, discarding all dubious options for active trading.
Joe DiNapoli "Trading Using DiNapoli Levels"
The book from Joe DiNapoli presents a description of well-known concepts and the author's original developments, and is a comprehensive educational approach to trading. What does it mean? There is no boring strategy or mechanized rules in the manual. Instead, the author presents an extensive overview of technical analysis and strategies, showing dozens of ways to make a profit, including his own developments. This is by no means general knowledge, rewriting the works of others, this is a comprehensive guide that traces the author’s vast experience as a teacher.
More details
Best brokers for 2020:
| Broker | Based | Regulator | Min. deposit |
| Alpari (Forex) | 1998 | CySEC, Central Bank of the Russian Federation, FinaCom | 1 USD |
| 24Option (Forex, CFD) | 2010 | IFSC | 200 USD |
| Migesco (Binary Options) | 2012 | TsROFR | 5 USD |
| InstaForex (Forex) | 2007 | CySEC, Central Bank of the Russian Federation | 1 USD |
| Binarium (Binary options) | 2014 | CROFR, CySEC | 9 USD |
| FxPro (Forex) | 2006 | FCA, CySEC | 1 USD |
| Binomo (Binary options) | 2014 | TsROFR | 10 USD |
| Forex Club (Forex) | 1999 | CySEC, Central Bank of the Russian Federation | 1 USD |
| FinMax (Binary options) | 2016 | TsROFR | 100 USD |
| Grand Capital (Forex) | 2007 | FinaCom | 10 USD |
+
Let's talk about the popular "signals" of investing com. Although it is not clear why this portal is called signals, it is not so important. Investing.com signals have been popular for many years and are used every day by traders from all over the globe.
On this resource you can actually find many rare charts. Additionally, we recommend reading our review of the economic calendar from investing.com.
Pay attention to this when trading binary options. Investing will not help you with this. But there are specialists of BO brokers and individuals who promote the possibility of easily accessible profits in the financial markets, offering it is not clear what from sites, passing them off as active signals for trading binary options.
You can detect such “signals” by going to technical analysis and clicking on summary technical analysis:
Remember that such actions can only be expected from scammers. There are plenty of them in the field of binary options and investing.
Investing signals for BO in theory
The developers of the site investing.com emphasize that they offer you a table that presents a summary technical analysis online. It is called summary because it is based on the readings of certain indicators and moving averages with unequal periods. That is, the developers themselves make it clear that these are not signals! You should not buy or sell options on them.
Various brokers and “experts” involved in promoting trading using signals from investing claim that you need to pay attention to those signals that are located under the tables with indicators (technical summary). But such online technical analysis should not inspire confidence. Buy, sell - it’s better to pass by. This analysis is not credible.
There are 5 types of signal data:
- buy intensively – a powerful signal, when all (or almost all) indicators show growth in the chart, then you need to purchase a call option;
- buy – not a strong signal, most of the indicators show growth in the chart, buy a call option;
- neutral – periods when there are no signals, in which case it is not worth trading;
- selling is not a strong signal, when many indicators show a decline in the chart, then you need to purchase a put option;
- selling intensively is a powerful signal, almost all indicators indicate a decline in the chart, we purchase a put option.
Free investing com signals are not suitable for complete trust and analysis, please keep this in mind. Although this all seems very true, be careful and remember that it is not true. You need to turn to various analyzes to see the whole picture.
We recommend reliable brokers:
| Brokerage office | Min. deposit | Min. bid | Bonus | Demo account | License |
| Binomo | 10$ | 1$ | Up to 100% | Yes | TsROFR |
| FinMax | 100$ | 5$ | Up to 150% | Yes | TsROFR |
| Migesco | 5$ | 1$ | Up to 110% | Yes | TsROFR |
| Binarium | 9$ | 1$ | Up to 60% | Yes | TsROFR |
| 24option | 200$ | 24$ | Up to 100% | Yes | IFSC |
A real look at trading signals investing
Experienced or at least slightly savvy traders who are well versed in their business say with confidence that investing com signals are like an average indicator. But the whole point is that it is impossible to trade well if there is a difference from the chart. And in general, it is not entirely clear what this set of indicators is based on.
These signals are similar to trading on the news (on the heads of bulls), they are very popular among beginners. Active, neutral, sell, buy – it’s simple. Nobody understands the essence of these “signals,” but everyone places bets regularly. After this, they write reviews that binary options are a scam. They say you can't make money from them. And newcomers who see these reviews bypass the real way to make money.
Let's look at a real situation. If you determine that ADX is rising, StochRSI is falling and CCI is at zero. How would you start bargaining? What time? What would the expiration be? What happens if there is a rollback? And if we consider the situation that the indicators in the equation are 11, and we also add to them 6 moving averages and 6 more exponential moving averages. That is, such trade can be safely called porridge. And in general, even the developers don’t call the summary table signals. Active, neutral - some kind of horror. But actually it is not.
You can make money on binary options, but you just need to study for this without looking for secret formulas. The best option in this case is to trust your technical analysis, and not aggregate data from obscure sites. It is clear that if you don’t work, nothing will work out. You need to buy options wisely.
Graphical models of technical analysis
Price volatility creates a chart in the form of a picture. Regular return to certain levels draws figures, as it were. They are similar to each other and are constantly repeated. In this regard, it becomes possible to make predictions about where the price will go based on graphic models.
Let's look at the most common of them:
- Head and shoulders. The formation of this figure occurs as a result of a stable trend of sufficient duration. Visually, these are three consecutive peaks, where the middle one forms a kind of head, and the two on the sides form the shoulders. There is a direct figure - the peaks point upward and a reverse figure, characterized by a minimum rate. With the help of such figures, analysis of cryptocurrencies , defined as technical, is available. Recognizing the patterns formed on the chart allows you to make a forecast regarding the expected price movement.
- Double top (bottom). A pattern with two tops that is created after an uptrend. Double bottom – downward trend. These figures are identical in relation to each other. The only difference is that they are opposites. This chart display is used in technical analysis as a signal about an upcoming change in trend direction.
- Rectangle. A figure demonstrating the rivalry between buyers and sellers. Such opposition leads to stagnation in the trend. Both sides have equal chances of making a profit. Those who buy and those who sell can count on success. It is important to pay attention to exactly how the price changes. If it moves in accordance with one of the horizontal sides of the rectangle, then the figure works. Otherwise, the chances of success tend to zero.
- Flag and pennant. A graphical model of this type appears after a sharp movement in the value of an asset in any direction (up or down). It is created during the pause of such a jump. The formation of such figures serves as a signal that we should expect a sharp change in the value of the cryptocurrency in the near future.
- Japanese candles. Candlestick figures appeared on the Japanese stock exchange. This happened in the seventeenth century. That's why they are called Japanese candles. The body of the candle is a distance that starts at the opening price point and finishes at the closing price point. At the same time, shadows of the candle are still formed, extending from the opening and closing prices to the peak price values. An increase in the upper shadow serves as a signal that the value of the asset is expected to increase. The lower shadow indicates a fall in the exchange rate. This method divides time into periods, which greatly simplifies tracking trends.
Don't overuse investing signals
In order to conduct high-quality analyses, it is necessary to use all the tools available to the trader. It is important to choose an analyzer that you can trust. But you shouldn’t rely on trading signals from investing.com in Russian. Only scammers will ask you to blindly follow investment signals. If you want to make a profit, learn all the intricacies of trading yourself. Then everything will be okay! Real-time technical analysis can really come in handy. It’s up to you to decide: study and earn money or don’t study and write that binary options are a scam.
Types of technical analysis indicators
- Lagging indicators (Moving Average, Bollinger Bands and others). This is more of a trend confirmation tool. Lagging indicators help us confirm whether a trend is continuing or weakening. These indicators follow price movement, as opposed to leading indicators.
- Leading indicators (Parabolic SAR, ATR, etc.). These indicators help us identify breakouts when the price is flat or out of trend. Leading indicators are used to predict price.
- Oscillators (Stochastic Oscillator, MACD, RSI, CCI and others). One of the most common types of technical indicators are oscillators. Oscillator values can range from a low of 0 to a high of 100, where 0 indicates oversold conditions while 100 indicates overbought conditions.
- Strength indicators. These indicators are rarely used, but they help determine the strength or weakness of a trend and also identify buy and sell signals.
Let's take a closer look at these and other technical analysis indicators.
The best Forex and binary options brokers
| Broker | Based | Regulator | Min. deposit |
| Alpari (Forex) | 1998 | CySEC, Central Bank of the Russian Federation, FinaCom | 1 USD |
| 24Option (Forex, CFD) | 2010 | IFSC | 200 USD |
| Migesco (Binary Options) | 2012 | TsROFR | 5 USD |
| InstaForex (Forex) | 2007 | CySEC, Central Bank of the Russian Federation | 1 USD |
| Binarium (Binary options) | 2014 | CROFR, CySEC | 9 USD |
| FxPro (Forex) | 2006 | FCA, CySEC | 1 USD |
| Binomo (Binary options) | 2014 | TsROFR | 10 USD |
| Forex Club (Forex) | 1999 | CySEC, Central Bank of the Russian Federation | 1 USD |
| FinMax (Binary options) | 2016 | TsROFR | 100 USD |
| Grand Capital (Forex) | 2007 | FinaCom | 10 USD |
Home » 【BINARY OPTIONS】 » INVESTING.COM TECHNICAL ANALYSIS ONLINE + 2016-02-24
In today’s article I would like to discuss the well-known investing com signals to everyone (or almost everyone). I’ll say right away that I don’t quite understand why they are called signals, but since this name has taken root more strongly than others on the Russian-language Internet, then so be it.
The investing information portal has existed for quite a long time and daily attracts the attention of more than a million traders from all over the world. As I already wrote in the article about turning points, on investing you can find a large number of rare charts, an economic calendar and a lot of summary data on almost all market assets. This information is purely summary and cannot in any way be regarded as signals to open transactions.
However, thanks to the managers of unscrupulous binary options brokers and people actively promoting the idea of easy money in the financial markets, information from the investing website began to be provided as direct signals for binary options trading. You can find the so-called investing com signals in Russian by selecting “Technical analysis” in the site menu and then clicking on “Summary technical analysis”.
Investing signals for binary options - theory
As you can see in the screenshot above, the creators of the investing site themselves called this table “Summary Technical Analysis”. It is called summary because it is the sum of the readings of various indicators and moving averages with different periods.
According to binary options brokers and so-called experts (would-be advisors) who promote trading using signals from investing com, a signal for binary options to open transactions can be considered a technical summary, which is located under the tables with indicators. There are 5 types of such signals:
- Actively buy – a strong signal, almost all indicators show an increase in the chart, buy a call option;
- Buy – a weak signal, most indicators show an increase in the chart, buy a call option;
- Neutral – there is no signal, we refrain from trading;
- Sell is a weak signal, most indicators show a fall in the chart, buy a put option;
- Actively selling is a strong signal, almost all indicators show a fall in the chart, buy a put option.
A sober look at investing trading signals
Any more or less experienced trader who is in good health and sober mind will tell you that investing com trading signals represent the average temperature in a hospital. First of all, because it is impossible to trade profitably apart from the chart. Secondly, because it is not at all clear what such a set of indicators is based on. Let's say you read that ADX is growing, StochRSI is falling, and CCI is near zero. Which direction would you take the trade? At what point? Until what expiration? What if a rollback suddenly occurs? Now let’s imagine that there are 11 indicators in the equation, and we’ll also add the readings of 6 moving averages and 6 more exponential moving averages. In a word, such trade cannot be called anything other than porridge. Moreover, even the developers themselves were hesitant to call this summary table signals.
To me, these signals are somewhat reminiscent of trading on the news (on the heads of bulls), which beginners love so much. Nobody understands how, what and why, but everyone makes bets regularly. And then reviews appear that binary options are a scam. Like, you can’t make money here. It is possible, comrades, it is possible, but for this you need to study on your own, and not look for the holy grail. The best option here is to rely on your technical analysis, and not aggregate data from some sites.
conclusions
To summarize, it must be said that for consistently successful trading on the Forex currency market, it is necessary to study both fundamental and technical types of analysis. By using one type of analysis, a trader deliberately limits his capabilities and will never achieve maximum efficiency.
If you do not take into account only technical analysis and do not even look at the economic calendar, you can receive a significant loss or even lose your deposit, for example, during the publication of the NonFarm Payrolls report, which can not only cause a sharp jump in the price, but also reverse the current trend.
Without using technical analysis, but completely concentrating on fundamental analysis, a trader will be surprised to see how, against a relatively calm political and economic background, a currency pair demonstrates sharp fluctuations caused, for example, by the closing of positions.
Use both types of analysis in trading, study fundamental and technical forecasts and reviews and let your trading be profitable!
Investing com signals: do not actively use
Regular readers of my blog have probably already noticed that to carry out analysis, I try to use the maximum number of tools available to a trader. However, even despite this, I do not recommend that you rely on investing com trading signals. And I am writing this because I sincerely believe that the basis of any human activity (including trading) should be an understanding of the subject and logic... By the way, more and more scammers are starting to use signals from investing in their scams, so be careful ( Now they are actively advertised by Alexander Volodin).
- home
- Education
- Articles
- Technical analysis of financial markets. Basics
October 9, 2020, 10:22 pm Read: 14909
Technical analysis of financial markets is suitable for both novice traders and professionals. We'll start this article by introducing beginners to the basics and then sharing some thoughts on the meaning and usefulness of this approach.
What is technical analysis
Technical analysis is the basis of trading; its essence is to conduct a statistical and mathematical analysis of encodings in order to predict price changes. It is the most popular approach to market analysis and building a trading strategy.
Note! The good thing about this method is that it allows you to take into account any influence on the price (for example, political, psychological or economic). The secret lies in the source data, the quality of which is taken into account only by statistics. Technical analysis takes price movement as a given, without taking into account the reasons at all.
Such statistical initial data can be considered:
- lowest and highest prices;
- opening price (in the time period taken into account);
- closing price (in the time period taken into account);
- operations performed and their volume.
I note that this type of analysis on the trading platform is determined by a series of graphs that provide accurate information about price movements (thus, the trader is able to determine the trend at the current moment in time). Almost all small and even medium-sized traders use this technique, and now we will look at the main assumptions on which the analysis is based.
Basics of Technical Analysis
Technical analysis is the analysis of quote history to predict future price movements. Supporters of technical analysis believe that market behavior repeats itself, and all fundamental factors (economics, politics, psychology) are already taken into account in the price.
That is why technical analysts (also called “techies”) rely on the chart when making decisions in financial markets. Based on the theory of technical analysis, the initial data are quotes - opening price, closing price, minimum and maximum price for a certain period, trading volume.
Technical analysis dates back to the 17th century in Japan, when rice traders tried to record changes in the price of their goods and, based on these records, predict where the price would go in the future.
Rules of technical analysis
It is not possible to master technical analysis in a few days.
This is a huge mechanism with a lot of data.
It is more correct to study it gradually, diving deeper and deeper, and at the initial stage you should learn three fundamental axioms - these are the fundamentals of technical analysis.
Prices take everything into account
The price that we see on the chart already contains all the necessary data.
It is a reflection of fundamental and economic factors, and technical analysis helps us not to delve into the complexities of fundamental analysis, and simply analyze the chart in the trading terminal.
Prices follow trends
There's not much to add here.
Any unidirectional price movement is called a trend.
Accordingly, it is either ascending or descending.
In contrast to the trend, there is a flat, or market uncertainty, which tells us about an almost equal ratio of sellers and buyers at the moment.
History repeats itself
The market is cyclical, and any event can have a historical analogue.
Today, technical analysis programs are used for this, and we can quickly find a match in the past and draw conclusions based on it.
Postulates of Charles Dow
The modern theory of technical analysis was described by journalist Charles Dow back in the 19th century and remains relevant to this day. It is based on the following key provisions:
The price takes everything into account
According to Dow, everything that happens in the financial markets is already factored into the price chart. At the same time, the price does not change by chance, but is the result of the combination of often multidirectional actions of various groups of market participants.
Prices move directionally
The current trend is likely to continue rather than change direction. Prices will move in a certain direction until there are reliable signs of a reversal. This is why inexperienced traders and investors are not recommended to work against the trend.
History repeats itself
If in the past certain formations on the charts gave signals about a continuation or change in the direction of price movement, then the appearance of similar signals in the future will likely indicate the same thing. Technical signals that worked 100 years ago are still effective today.
Trends are confirmed by volumes
If upward movements in the market are supported by increasing volumes, and downward movements are supported by decreasing volumes, then the price is likely to rise. If upward movements in the market are accompanied by a decrease in volume, and downward movements are accompanied by an increase, then the price will most likely decrease. Those. trading volume should increase in the direction of the trend.
Assets move in concert
Track correlations between different instruments. Also take into account the fact that correlations change over time. Accordingly, when making an investment decision, you need to familiarize yourself with the situation in other sectors of the market.
The modern form of technical analysis emerged with the development of computer technology already in the 1990s. Modern traders have the opportunity to make calculations in a split second that took their predecessors days and weeks, because they had to draw charts themselves.
Forex technical analysis
The legendary American investor George Soros argued that fundamental analysis is enough to make a profit. ForTrader.org magazine does not undertake to argue with “the man who brought the Bank of England to its knees,” but, firstly, it seems to us that Soros is a little disingenuous in this matter, and secondly, we do not have such large finances that they turned, like Soros, into a tool for influencing currency quotes.
For trading itself, a trader needs technical analysis. Technical analysis Forex operates with mathematical models - price charts, technical indicators, price levels and zones, etc.
Technical analysis is based on three postulates:
- The price takes everything into account;
- Price movement is subject to trends;
- History repeats itself.
Based on these postulates, analyzing previous data, stock analysts and financial experts can make a technical forecast of the exchange rate of a currency pair, which will take into account not only the direction of the trend, as in fundamental analysis, but will already have clear levels of entry and exit from the market in the form of trading signals .
Of course, everything can be learned by comparison, and there is no need to use technical Forex forecasts as a direct guide to action. As they say, everything is learned by comparison. By testing the signals of different analysts on a demo account, you can verify their degree of effectiveness and make a trading decision yourself.
Technical analysis for beginner traders
There are three different types of charts in technical analysis: line, bar, or candlestick charts. The Japanese candlestick chart is considered to be the most popular and informative today. You can get acquainted with the basics of candlestick analysis by reading this article.
To carry out technical analysis, you can use computer indicators - they allow you to quickly and easily get acquainted with the current statistics of price movements, discarding unnecessary noise.
Other traders do not use indicators because they believe that they only complicate the analysis. Such analysts look only at the price, evaluate the patterns and formations that have formed on the chart. You can read more about these technical analysis methods here.
The logic of technical analysis is as follows: each Japanese candle (bar, point) on the chart is an expression of the opinion of millions of traders. This is exactly what the balance of supply and demand looks like at the moment. Market participants “vote” for the further direction of price movement by opening a deal in their trading terminal. They buy if they believe prices will rise and sell if they expect prices to fall. If market participants are not confident, they do not make transactions and the price stands without moving in a sideways range.
Thus, the technical analyst does not try to understand the reasons for the price movement - he leaves these thoughts to the “crowd”. It is important for him, looking at the chart, to assess the market mood and analyze the cardiogram of the players’ behavior. To do this, just look at how quotes and trading volumes change.
Why do technical analysts trust other traders so easily, you ask?
The answer lies in human psychology. The fact is that, given the same circumstances, people tend to make the same decisions. This can be called stereotyped thinking. Technical analysts know these stereotypes and, based on them, try to predict where the price will go today.
Benefits of Technical Analysis
Technical analysis today is one of the main tools of a trader.
It allows you to assess the situation and make decisions without delving into fundamental factors and economic subtleties.
It has a lot of advantages, so let’s focus on the three most important:
Does not require special knowledge
Analytics today, in which technical analysis is the main tool, does not require the trader to have in-depth economic knowledge.
To successfully trade in the market, it is not necessary to receive a higher education in economics or mathematics and understand all the intricacies of world trade.
It is enough to master the principles of TA and build your strategy on their basis.
Availability
Anyone can learn TA, and no academies or institutes are needed for this.
Yes, at first glance it may seem very complicated, but in fact, each element is subject to logic, and you just need to understand the mechanism, how the market works and on what basis conclusions are drawn.
As for information, there is a lot of it on the Internet, and it’s completely free. All that is required from a trader is perseverance and patience, and then, as they say, it’s a matter of technique.
Versatility
TA is not limited to one currency pair. It is relevant for any assets.
All currency pairs are subject to the same laws, and some are also interconnected, which provides additional opportunities for making a forecast.
Having studied the basics and principles of technical analysis, you will be able to trade any currency or commodity, slightly adjusting the strategy based on the individual characteristics of the asset, if any.
Does technical analysis work?
No one can predict movement with 100% probability. This is a scientific fact. However, technical analysis is a very useful tool for “reading” the chart and choosing the opening and closing points of a position. It will truly improve your chances of making an effective trade in the market.
Today, there are many different trading systems roaming the Internet, promising to earn millions in financial markets based on technical analysis signals (“one moving average has crossed another from top to bottom - tomorrow there will be growth”).
We do not share the optimism of the authors and buyers of such courses. Such a simplified presentation creates in novice traders the illusion of omniscience, false confidence, which is quickly and successfully converted into loss of deposit for the trader and stable income for such “teachers”. From here we see crowds of failed traders shouting on every corner that the financial markets are a scam.
If used incorrectly, technical analysis will bring you approximately the following results:
Knowledge of the basics of technical analysis is a necessary component of stock market literacy, but it is, of course, not the holy grail. Financial markets are a multifactorial, complex and interesting model that needs to be observed as a whole, taking into account fundamental factors as well. The more experience you have in the market, the more books you have read and crises you have experienced, the more effectively the methods of technical analysis will work for you.
Next article: Price Action. Secrets of trading without indicators
Subscribe to our Telegram channel - we will tell you where to invest money in 2020
Here we will analyze investing.com signals , their advantages and disadvantages. This site offers signals to encourage traders to buy or sell. Accordingly, many people have a question about whether they should trust the information presented.
To begin with, we note that this portal began its existence back in 2007. In ten years, it has managed to attract a huge number of traders from all over the world, which is not surprising since it is presented in 18 languages. Additionally, we recommend reading our review about signals for binary options.
The portal publishes not only signals based on indicators, summary tables, but also a large amount of the latest news from financial markets around the world, and economic calendars. The information on the charts is generalized, and therefore not everyone agrees that it is called a signal. Investing com signals can be obtained through technical analysis in real time using a summary table.
You need to go to the investing.com portal, then select the Technical Analysis section on the top panel, then Summary Technical Analysis.
Technical analysis for beginners. (Reuters Finance Series)
This book is a project of the famous company Reuters, one of the leaders in the supply of financial information. Few people know, but the company is already about 165 years old! Many banks and brokerage companies use the information provided by Reuters. This book is about technical analysis for beginners. Covers all the necessary topics to quickly cover all the necessary topics. The material is presented very clearly and clearly. A beginner entering the market is in a stage where a huge flow of information is bombarded, which is difficult to effectively absorb.
More details
Signals investing.com, general information
On investing.com, the signals are compiled into Summary Technical Analysis, which got its name because it uses aggregate data from moving averages and various options indicators.
Binary options brokers engaged in trading with the help of investments, and focusing on the advantages of the signals of this resource, called “signal”, imply a summary of a technical nature. Such signals are located on the technical analysis page and are located under the summary tables of indicators.
The following types of signals are distinguished on the site:
- Strong signals : these include Active Buy and Sell signals. In the first case, indicators indicate an increase in the chart and encourage active purchase of a call option. In the second, the charts, on the contrary, are lower for all indicators, and therefore you need to actively buy a put option.
- Weak signals : Buy and Sell. In the first case, only some indicators indicate growth in the chart, and buying is a call option. With the second signal, most indicators indicate a fall, so it is worth buying a put option.
- There is no signal only in the Neutral position of the indicators. In this case, you should refrain from trading.
By analyzing these signals, according to brokers involved in the sale of binary options on this site, you can get a successful transaction. They claim that online technical analysis is very effective and the indicators are set accurately.
Our recommended binary options brokers:
Traders' points of view on investment signals
Traders' opinions differ in many respects, and by reading reviews of signals, you can be convinced of this. The fact is that it is not entirely clear how the analyzer works. Based on what data are graphs and signals created? Site experts who provide specific tips receive payment for their work directly from those sites that are represented in the signal analyzer. How honest these signals are is up to you to decide.
You see a picture of binary options signals that has developed exclusively at the moment. You are not able to view statistics over a long period of operation of a particular options broker. All movements of the asset remain a mystery, and you cannot say with confidence that it is currently worth trading actively.
Beginners blindly buy binary options paying attention to indicators, and therefore, sooner or later the deposit is drained. A huge number of negative comments appear, which force many to wander around the Internet in search of the truth about signals. In most cases, in order not to bother, users call investing.com a scam and close the site page in disappointment.
Sources used:
- https://investoram.org/binary-options/texanaliz-investing-com-na-russkom/
- https://traderhelp.info/binary-options/signaly-investing-com/
- https://boexpert.ru/signaly-investing/
- https://investfuture.ru/edu/articles/tehnicheskij-analiz-rynka
- https://treidinglike.blogspot.com/2019/03/blog-post_438.html
SHARE Facebook
- tweet
Previous articleA hidden setting in all Android smartphones allows you to enable a dark theme
Next articleSecret codes of ASUS Zenfones ASUS Zenfone in”‚4v”‚5v”‚6v”‚Official