Typically, the standard set of a trading terminal includes only those indicators that really help to effectively predict price movements. All the most interesting things in terms of algorithms have long been invented, so most of the presented technical analysis tools date back to the last century. One of these old-timers of analysis, along with MACD, is the stochastic indicator . This is a very easy to learn indicator that has a number of advantages compared to other classic analysis.
| № | BROKER | LINK | MIN. DEP | FOUNDATION YEAR | REGULATOR | DEMO | MOB. | CONCLUSION | GRADE |
| 1 | REGISTER. | from 0$ | 1998 | FSA, TFC | PAYS | 9.9 | REVIEW | ||
| 2 | REGISTER. | 10$ | 2009 | ISFC, CySEC | PAYS | 9.7 | REVIEW | ||
| 3 | REGISTER. | 100$ | 2007 | The Financial Commission | PAYS | 9.1 | REVIEW |
From this article you will learn:
- Stochastic oscillator - what is it? What is it for?
- Stochastic signal zones
- Using stochastics in trading
- Stochastic and MACD
- Conclusion
Stochastic oscillator - what is it? What is it for?
Stochastic (stochastic oscillator) is an indicator that is based on moving averages and has a relative evaluation function, that is, it has a smoothing component. Stochastic is designed to determine reversals; it is perfectly used in sideways and trending situations, that is, it can be called a universal tool for technical analysis.
To make it more informative, the stochastic is combined with other indicators, for example, MACD or Bollinger, as well as with graphical and candlestick analysis. You can also often see a stochastic window on charts with wave markings, since the signal of divergence and convergence is quite relevant not only for the usual search for a reversal, but also for determining some phases of wave structures.
The creator of the indicator, George Lane, paid attention to how the current bar closes in relation to the previous ones. As you know, sharp fluctuations are possible by the end of the candle period. That is, during the formation process it can take almost any shape, but at the very end, literally in a few minutes, completely change it. That is, there was, for example, a confident falling candle, with small shadows and a large body, which quickly turns into a Hammer reversal figure. This is why, by the way, it is recommended to open trades only at the opening of a new bar of the working period. This method of work allows you to work with up-to-date data, eliminating the possibility of an unsuccessful login due to haste.
So, the stochastic indicator works on a simple principle: a numerical assessment of the price level at which the current bar closes is carried out in comparison with the levels of previous bars. That is, in fact, we just look, there is a sequential closing lower and lower, that is, a bearish trend is developing, or sequentially higher and higher, that is, a bullish trend. This approach allows you to assess the real situation, because candles may have long shadows, but a trend closure does not occur. These are usually signs of a flat or reversal.
To better understand the algorithm, you need to look at the value of each of the lines, which we will analyze in the stochastic settings section. There are many modernized versions of the indicator, but they do not always bring anything useful, so it is better to use a simple version.
The essence and settings of the stochastic oscillator
The price of an asset is determined by supply and demand. As soon as the price starts to rise for some good reason (for example, a stock has a positive earnings report for the reporting period), speculative capital comes into play. The higher the price, the more traders continue to push it up. At a certain point, there comes a realization that the price of the asset is too high and demand stops. This zone is called the overbought zone.
Stochastic oscillator is an indicator that displays the current price value in comparison with the price range for a certain past period. The stochastic value is measured as a percentage. Since the price cannot go beyond the imaginary corridor of 0-100%, an oscillator value above 80% means that the price of the asset is too high, and below 20% it is undervalued. Finding the indicator in these zones means an imminent price reversal.
The stochastic formula was developed in the 1950s by George S. Lane and has undergone some changes over time. Today, the stochastic formula is so complicated that it is practically impossible to calculate its value manually.
I also recommend reading:
RAMM trades copying service from AMarkets
What is the RAMM service and how to copy trades in it
In MetaTrader 4 you can find stochastics in the menu “Insert-Indicators-Oscillators”. Its basic settings:
Stochastic settings value:
- period %K;
- period %D;
- slowdown - smoothing the %K and %D lines, eliminating price noise (abnormal fluctuations);
- prices - select the price value at which the calculation will be made. Low/High - based on the upper and lower values of the candles, Close/Close - based on the closing price;
- MA method - the principle of calculating the %D line, everything is similar to the parameters of the standard moving average;
- colors - color of lines and type of display of the main and signal lines (solid and dotted);
- levels—display levels, the intersection of which will be a confirmation signal to open a position;
- display - timeframe selection.
Graphically, the stochastic oscillator is displayed by two lines: the main one (solid in the basic settings) and the signal line (dotted).
Setting up stochastic
In the list of indicators, select the Oscillators section and click on Stochastic Oscillator . The indicator is displayed in a separate area under the chart and is represented by a space with horizontal levels of 20 and 80 marked on a scale, while the area itself is limited by 0 and 100. Stochastic consists of two lines that periodically intersect. They move between the indicated extreme levels, if the price moves down, then the stochastic will also go down (both lines), if the price goes up, then the lines will go in the same direction. The settings window offers several customizable values, let's look at each of them:
1. The period of the main line, denoted %K . This is essentially the stochastic oscillator itself, that is, its main line. It is calculated as the result of dividing the difference between the price of the current period and the minimum price value for a specified period of time and the difference between the maximum and minimum prices for the same specified period. This whole fraction is multiplied by 100 to get the final value. It is logical that with dynamic growth and closing at the maximum, the stochastic indicator will be around the value of 100, and with the same fall and closing at the minimum, it will be around 0.
Here, by the way, a certain drawback appears, which will have to be compensated for later by waiting for confirmation - the indicator lines can remain near the boundaries of the area for a very long time.
Initially, the value 5 is used - it is convenient and works well, making the stochastic oscillator very sensitive to price fluctuations. If you increase it, it will become more similar to chart oscillators, which do not move as dynamically, since they provide for the assessment of a larger chart period. In general, for most Forex strategies, standard values are quite suitable, which, by the way, are better to change all together, since significant changes in one parameter will lead to a not entirely clear display and distortion of signals.
2. The period of the second line, denoted as %D . In the window it is displayed as a red dotted line, following the main one with some delay. The reason for this delay is that %D is an average of the underlying %K. That is, the parameter value that is set will indicate how many main line values will be used to calculate the average. By default it is also 5, which can be called optimal. As a result, it turns out that the current value of %D is the average %K for 5 bars. The intersection of these two lines will give a certain signal, which will be discussed later, that is, the line is quite important.
3. Slowdown . A parameter that, when changed, will either increase the frequency of occurrence of signals with lines entering the area between 20 and 0 and between 80 and 100, or decrease it. The initially set value of 3 smoothes the indicator quite well, so there is no particular point in changing it in isolation from the other parameters.
4. Prices. Here is a list of options for values that the Stochastic indicator will take as values for calculations. Just like with the slowdown, there is no need to change anything; the default value is used in almost all trading methods. As a last resort, you can change it if so provided by any strategy, but usually everyone adheres to the standard value.
5. Type of moving average . Everything is standard - we have a whole list of moving average types to choose from - from simple to smoothed. As a rule, they work with the usual, that is, simple moving average.
Stochastic Oscillator Derivatives
The simplest manual Forex strategies are based on the simultaneous use of 2-3 indicators. Those who prefer to look for the most accurate entry points into the market try to overlay 4 or more indicators on the chart, resulting in an oversaturation of information. For such cases, combined tools are created that combine information from several indicators.
I also recommend reading:
The Central Bank of the Russian Federation canceled the licenses of the Forex club, Teletrade and Alpari
Why Alpari, Forex Club and Teletrade lost their license from the Central Bank
For example:
- jurik BrainTrend1Sig. It is based on an algorithm that is calculated using the values of the classic basic indicators ATR and Stochastic Oscillator. Even strategies based only on this combined instrument show profits;
- Hooya Map. It is based on three classic indicators: stochastic oscillator, moving average (MA) and MACD. The combined indicator displays a summary value so as not to clutter up the charting;
- Slow Stochastic. It differs from the basic indicator in that its calculations use the sum of the values of the last three candles, divided by three. Slowing down the readings allows you to partially level out the noise and get a smoother line;
- The indicator is based on the theory of stochastic threads, developed in 2007. It represents 8 stochastic oscillators that have the same deceleration values and %D period, but differ in the %K period values;
- An indicator whose main algorithm draws a channel, and an additional indicator (stochastic) confirms the strength of the buy or sell signal.
All these indicators are not included in the standard MetaTrader 4 settings, but are downloaded and installed within 5 minutes.
Signal zones of the stochastic indicator
The fact that the stochastic indicator has a limited scale of values makes it possible to evaluate the movement based on the value itself. For the convenience of the trader, the indicator has the ability to configure the display of horizontal levels, which are initially indicated at 20 and 80. These lines form intervals of values that are usually divided into the following:
- Overbought zone . It is located above the stochastic values of 80 and rests on the upper limit of the values. Thus, when the price rises, the stochastic rises and often ends up in that area. This is usually interpreted as a possible downward reversal, but the very fact that the lines have entered the area does not yet give a reason to enter the market.
- Oversold zone . This is the area of other extreme values that the stochastic oscillator sometimes shows. It is located below the values of 20 and also rests on the border, only now the lower one. The indicator lines enter it when the price falls, but just as in the previous case, this is not a signal to buy. We will consider how to act in such situations below.
In general, values of 20 and 80 are good for standard parameters, but you can often see 25 and 75, as well as 30 and 70. This is usually done when changing indicator parameters, but we will consider the usual trading method. So, when the price has entered the overbought zone, the procedure is as follows:
- We wait until the main line crosses the dotted line from top to bottom . This can happen at the border itself, and then the signal will not be of very high quality. It is better when this happens in the area itself, that is, the reversal should be above level 80 and at the same time clearly visible.
- The next important condition for concluding a deal is that these indicator lines go beyond the overbought zone . That is, you need to wait not only for the moment when they leave the area, but also consolidate below the 80 mark. To do this, we wait for the current bar to close. While it is forming, you can’t be sure of anything, since it’s the closing level that is important. Already at the opening of the next one, if the lines remain below 80, you can open a sale.
Exactly the same scheme of actions with the oversold zone, only in this case the indicator values from 0 to 20 and the reversal of the lines upward with a fixation above 20 are already considered.
Using stochastics in trading
Now let's move on directly to market situations in which you can act according to the indicator indicators. The main area of application is searching and confirming a change in trend in the market, in connection with which two main action patterns can be distinguished depending on what is happening with the price:
1. Consolidation is taking place in the market . This can be understood after the price makes oscillatory movements within the horizontal channel for some time. The absence of a trend makes it possible to trade in both directions, but as consolidation continues, preference should still be given to the main direction. So, here we will use the reversal zones that were described earlier. At the same time, it is important to highlight the boundaries of our consolidation in order to have a reference point and wait for a signal from the indicator near them. The fact is that the stochastic indicator is more suitable for waiting for confirmation if we use standard parameters, so we work out the signal when the price approaches the border and begins to reverse.
The main role of the stochastic in such trading is to give a signal regardless of whether the price has reached our level or not. It is also impossible to exclude the possibility that the boundaries are redrawn, that is, false breakouts occur and then the price reverses. In this case, the second factor will be the stochastic oscillator. That is, the first condition is being near the border, the second is a stochastic signal.
2. There is a trend in the market . The best option is to see a reversal in higher periods and open a trade. It should be noted here that using H4 or D1 on time frames significantly increases the efficiency of the indicator, which, however, is not surprising, since almost all old analysis algorithms are designed for medium-term trading.
So, for example, we found a reversal on H4. After this, we enter a trade and wait for the trend to develop. It is clear that as the movement progresses, reverse signals will also arise, but they must either be ignored, or at such moments, close part or all of the transaction. This happens due to the fairly short period, although there are situations when the stochastic is in the signal zone for almost the entire trend.
Also, among other things, it is proposed to use stochastics to build up the aggregate position. In this case, we use corrections, which almost always inevitably occur during a trend movement. That is, according to stochastics, a position is opened in the main direction. For example, if we have a bullish trend and we entered a buy position at a reversal, then we should wait for the same signal - the Stochastic indicator goes into the oversold zone and turns around there.
3. Divergence and convergence . This is a reversal signal that is typical for all oscillators. It consists in the fact that there is a discrepancy between the maximum and minimum of the chart and the indicator. That is, it turns out like this:
- divergence is formed if the price makes two successive highs with a rollback between them, but on stochastics the second high is absent, that is, it shows a lower value than the first;
- Convergence is formed according to exactly the same pattern, but we are talking about a bear market and a reversal upward. There will also be two price minimums here, but on stochastics the second will be higher than the first.
By what principle is the Stochastic oscillator calculated and how is it constructed?
As mentioned above, the Stochastic oscillator consists of two moving average lines:
- %K - fast stochastic
- and the second %D - there will be a slow stochastic moving within a virtual corridor along three special zones - the upper overbought zone, the middle neutral zone and the lower oversold zone.
This chart displays the type of oscillator indicator that is applied to price maneuvers.
It shows:
- line “1” is an overbought zone, in which a downward price reversal is likely to occur;
- line “2” - oversold zone (price reversal upward);
- “3” is the neutral zone. If you use standard settings, the overbought zone will be on the chart ranging from 80% to 100%, and the oversold zone will be 0% - 20%.
- Slow Stochastic (%D) is a moving average of relatively fast Stochastic (%K) with a short averaging period.
It should immediately be noted that various averaging mechanisms can be used, i.e. simple average, smoothed, exponential, weighted, etc.
We recommend: Learn about averaging mechanisms in detail
Video. Review and setup of the stochastic oscillator (stochastic). Main entry points
In this video review you will learn how to set basic settings and, moreover, find optimal entry points into trading using a strategy based on a stochastic oscillator:
Stochastic Oscillator settings, for MetaTrader
The formula for calculating Stochastic will be as follows:
%Kt=/*100, where
- "Ct" is the closing price of the current trading period;
- "Ln" represents the lowest price in recent periods "n";
- "Hn" is the highest price in recent "n" periods.
Selecting a period for the Stochastic Oscillator
When traders use the Stochastic Oscillator when trading on the Forex market, the choice of the period of this indicator is experimental, and its selection depends directly on the current market situation. But often, most traders use standard values, which has virtually no effect on the effectiveness of its use.
It is recommended that in case of high market volatility, choose a longer period, for example, 21 or even higher. This will make it possible to reduce the sensitivity of the oscillator and thus weed out unnecessary false signals.
In a sluggish market, the opposite situation arises and here the accuracy of Stochastic should be increased by reducing its period, for example, to 9.
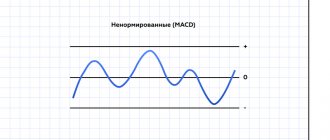
Stochastic and MACD
Despite the fact that these are indicators of the same group, their simultaneous use can often be seen among traders. This is very convenient, since one will be designed for signals of higher quality in terms of period, and the other can be used for confirmation in the short term. For greater convenience, they are placed in the same window, only in this case you need to check the setting parameter called “fix minimum/maximum”. In this case, on the right there will be a scale familiar to stochastics, and MACD will draw its diagram on the appropriate scale.