Oscillators. Basic principles
Oscillators are leading indicators. Under certain conditions, they allow you to predict a trend reversal. They are one of the most valuable tools in a technical analyst's arsenal. At the same time, very often oscillators are used incorrectly.
If trend indicators record and confirm the presence of a trend, then oscillators can signal a reversal of the trend and make it possible to predict market trends rather than follow them. The reliability of their signals is much lower than the reliability of trend indicators and should be followed with caution.
Oscillators are effective precisely in the absence of a clearly defined trend (global trend) in the market, when the price fluctuates in a relatively narrow trading range. Most trend indicators give many false signals during a flat, and oscillators allow a trader to make a profit during this period.
There are many different types of oscillators, their charts are located below the price chart in a separate window. The scale of changes in oscillators can be different depending on the method of calculation and construction.
The most common ones in technical analysis are:
- Speed oscillators: – Relative Strength Index – RSI (Relative Strength Index) – Stochastic Oscillator – MACD (trend oscillator, combines the characteristics of both types. We have already looked at it in the “Trend Indicators” lesson)
- Volatility oscillators: – Average True Range (ATR – Average True Range) – others, less common
- Volume oscillators. They include an analysis of trading volume, but in practice the volume indicator is self-sufficient, and its inclusion in the oscillator formula unnecessarily complicates the final indicator. – Volume Oscillator – Chaikin Oscillator – Money Flow Index (MFI – Money Flow Index)
Oscillator classes
There are two classes of oscillators - normalized and non-normalized oscillators.
Ordinary (unnormalized) oscillators have no limits for fluctuations in values.
The values of normalized oscillators change on a strictly limited scale, usually from 0 to 100. The middle line is 50.
The main feature of normalized oscillators is the presence of overbought and oversold zones on their scale. When the oscillator curve reaches these zones, the trader receives a signal that the stock is “overbought” or “oversold.” In the first case, a sell signal appears, and in the second, a buy signal. But it must be remembered that these signals must be confirmed by other technical signs of decline or growth.
In theory, when the oscillator value reaches the lower or upper critical zone, the current price value is extreme and a price reversal or at least a corrective movement should be expected.
Relative Strength Index ( RSI)
The relative strength index is one of the most popular oscillators in technical analysis, developed by Welles Wilder in 1978. Like many other indicators, it is calculated based on closing prices and shows which group dominates the market at the moment (“bulls” or “bears”, that is, buyers or sellers).
Wilder used the term “relative strength” to describe the ratio of the average price increase to the average price decrease over a period. This value allows you to assess whether buyers or sellers had a stronger influence on the price in the selected period and suggest further developments.
To calculate relative strength, all candles of a selected period of time are selected that closed higher than the previous candle, and the average value of the increase is determined using the exponential moving average formula.
A similar operation is performed for candles that closed below the previous one. The ratio of these two quantities will give the relative strength (RS) value:
\(RS = {EMA_n(Up) \over EMA_n(Down)}\)
For convenient display on a graph, the resulting value is converted so that the values fall within the range from 0 to 100%. The result obtained is the relative strength index, the dynamics of which can be seen on the indicator chart.
\(RSI = {100} - {100 \over (1+RS)}\)
Most of the time, the indicator curve is in the middle of the range (in the 50% area), but at moments of reversal of a strong trend it reaches extreme values in the overbought or oversold zone.
The upper limit of the oversold zone is usually set at 20%, and the lower limit of the overbought zone is usually set at 80%. The option of 30% and 80%, respectively, is also possible.
General rules for oscillator analysis
It is advisable to use oscillators in four main cases:
- Finding the oscillator curve in the overbought or oversold zone.
- When divergence (this is a discrepancy between the extreme values of the price chart and the oscillator chart.
- The oscillator curve crosses its zero line, and the direction of the oscillator coincides with the direction of the current trend.
- Analyze chart patterns and support or resistance directly on the oscillator chart.
As already noted, most oscillator signals turn out to be false in the presence of a strong trend, but are effective when the trend is fading or in a flat. If there is a pronounced trend in the market, the most successful are trend trading strategies and opening positions in the direction of the existing trend.
However, the value of oscillators increases in two cases:
- trend fading and trend completion
- trading within a range.
Thus, to effectively use oscillators, it is necessary to first analyze the price chart: identify levels and lines of support and resistance, and determine the presence of a trend. The use of technical analysis figures is also encouraged.
Divergence
In a broad sense, divergence refers to the discrepancy between the dynamics of a price chart and the dynamics of a technical indicator. Consequently, divergence can only be observed with the help of leading indicators (oscillators), since they are the ones who are able to “predict” the price movement before it has finally formed.
There are “bullish” and “bearish” divergences, which indicate a likely reversal of the trend to upward and downward, respectively.
“Bearish” divergence is formed on a growing trend, when a new maximum appears on the price chart, while the oscillator also grows, but without updating the extreme. This situation indicates weakening buyers. Since sellers have not yet had time to become more active, the price continues to rise for some time. Then, with a high probability, the trend reverses or corrects.
“Bullish” divergence is formed on a falling trend, when a new low on the price chart is not accompanied by a new low on the oscillator, which signals an upward price reversal or an upward correction.
The strength of divergence increases with increasing time frame: on weekly, daily and 4-hour charts this signal is more reliable than on 15-minute and lower charts.
Overbought and oversold
Overbought and oversold is a property of exclusively normalized oscillators. Since their values are always in the range from 0 to 100, by analyzing historical data you can easily verify that the indicator values rarely rise to 100 or fall to 0. As a rule, the indicator spends most of its time in the central zone, accepting anomalous values only in moments of rush purchases or massive sales on the market.
By analyzing historical data, it was revealed that extreme zones (those in which the indicator spends no more than 5% of the time) are the boundaries from 0 to 20 for a falling market and from 80 to 100 for a growing market. If the indicator value falls into one of these zones, it means that the market is overheated by the bulls or oversold by the bears, and there is a high probability of an imminent reversal.
Overbought and oversold have wide possibilities for practical application. Indeed, a pronounced trend movement sometimes artificially drives the indicator into an anomalous zone, thereby giving the trader false signals, but none of the technical indicators can boast of absolute accuracy in predicting market movements. A stronger signal to execute a transaction is not the entry or the presence of the indicator in the normalized zone, but the moment of exit from it.
This oscillator signal is a signal of medium strength. This means that during a strong trend movement its signals may turn out to be false, while during a fading trend its use helps to open positions in a timely manner at more favorable prices. Therefore, it is necessary to take into account overbought/oversold signals while monitoring the strength of the trend - for example, using the MACD indicator.
Crossing the midline
The value scale of any oscillator has a middle line: for normalized oscillators this value is 50, for non-normalized ones it is 0. The middle line of an oscillator essentially represents the boundary between growth and decline, the “bullish” zone and the “bearish” zone. Therefore, crossing the middle line from bottom to top indicates a change from decline to growth and gives a signal to buy, crossing from top to bottom is a signal to sell.
Signals that arise when crossing the middle line have a trending nature, although they are formed by oscillators. Trend signals are lagging and should therefore only be considered in the direction of a strong trend and rejected if they contradict the current trend.
Compared to trend indicators (for example, the intersection of two averages), the oscillator crossing the average line generates a greater number of false signals.
A comparison of signals using the example of the intersection of two averages and the RSI oscillator is shown in the figure. The moments of opening trend positions based on the signals of a pair of moving averages and the intersection of the middle line by the RSI indicator coincide with an accuracy of 3-4 candles. At the same time, during the period under review, RSI managed to generate 2 false signals, opening positions on which would have led to unprofitable transactions.
In practice, the market can be in only two states: trend or flat. From the point of view of crowd psychology, the moment of crossing the midline precisely characterizes the point of redistribution of the forces of “bulls” and “bears” and gives us a signal to join the group on whose side there is an advantage.
If there is a clear, strong trend movement, the oscillator crosses the middle line only once, giving 1 signal to make a trade in the direction of the trend. If we want to increase the reliability of this signal, we will have to check it using trend indicators.
Since the signal from oscillators appears shortly before the signals from trend indicators, there is often no need to consider trend signals from oscillators.
If the market is in a trading range, then the RSI-type oscillator makes oscillatory movements around the middle line, without demonstrating obvious dynamics, and forcing us to make many unnecessary transactions.
In this case, it may be advisable to change the calculation period of the oscillator or use a more sensitive analogue. For example, the stochastic oscillator is considered more sensitive to market changes compared to the RSI. Accordingly, unlike an inertial oscillator, a “fast” analogue will generate buy or sell signals, reaching oversold or overbought zones, and not cruising around the middle line.
Stochastic Oscillator
The stochastic oscillator (or stochastic) was developed by trader George Lane for trading the futures markets and is described in detail in his book Self-Managed Trading with Stochastics.
To illustrate the operation of his indicator, Lane gives the example of a rocket launched into the air, the speed of which certainly begins to decrease before the rocket falls down. Similar to the price of a financial asset: the impulse always changes its direction before the price direction changes.
According to the principles of calculation, the stochastic oscillator is very similar to the relative strength index. It is also a normalized oscillator and has overbought and oversold zones; it gives the same signals for opening and closing positions. Mathematically, stochastic expresses the relationship between the current closing price and the high-low difference for a certain time period. The indicator is reflected as a percentage from 0 to 100%.
%\(K = {100}\times {(Close - min_n) \over (max_n - min_n)}\)
%D = MA (%K, T), where:
- %K – fast stochastic (red on the chart)
- %D – slow stochastic (black dotted line on the chart)
- Close – candle closing price
- minn – minimum in the selected range
- maxn – maximum in the selected range
- n – number of periods for stochastic calculation (number of candles)
- T – smoothing period
Thus, the stochastic shows whether the bulls or bears managed to close the prices of the period near the upper or lower limit of the trading range (while the RSI only takes into account those closing prices that were above bkb below the previous one). The slow stochastic is a moving average of the fast stochastic. The intersection of fast and slow stochastics acts as an additional signal for a trade.
The stochastic oscillator is more accurate (that is, sensitive to price changes), therefore it is more suitable for trading on the flat.
An additional signal of the stochastic oscillator is the intersection of %K and %D. If %K crosses %D from bottom to top, it is a buy signal, and the opposite cross is a sell signal. These lines can intersect both in the middle zone and in overbought or oversold zones. In the second case, the indicator signal is an order of magnitude stronger.
ATR. Average true range.
The average true range, or ATR (Average True Range), reflects the price volatility on the chart.
First you need to understand what the True Range (TR) shows. It is calculated as a maximum of three quantities:
- difference between the high and low of the current candle
- the difference between the high of the current candle and the closing price of the previous candle
- the difference between the closing price of the previous candle and the low of the current candle
\(TR_t = {max [High_t - Low_t; High_t - Close_t-_1; Close_t-_1 - Low_t]}\)
In the last two cases, there is a gap between the minimum (maximum) of the current candle and the closing price of the previous candle. This difference must be taken into account in the formula.
Essentially, TR is the maximum price spread over a single time interval (for example, per hour on an hourly timeframe or per day on a daily timeframe).
Based on this indicator, ATR is calculated. It has a single parameter - period N. As a rule, a 14-period or 7-period indicator is used, but it can be customized to suit your own strategy.
\(ATR_t = {((ATR_t-_1\times(n-1)) + TR_t) \over n}\)
The formula is analogous to the exponential moving average. In a simpler version, ATR is calculated as the arithmetic average of TR over period n. Thus, ATR represents the average distance that the price travels in a unit time interval.
The indicator itself does not provide direct signals for making transactions, but is used in combination with other indicators.
ATR shows volatility and can indicate the current state of the trend and activity in the market:
- low values may indicate a temporary price slowdown or flat
- high values may indicate the culmination of a trend
Armed with the ATR value, a speculator can understand how much margin is left for the price to move up or down. For example, if a trader is trading on an hourly time frame, he can calculate the ATR for a candle on a daily chart (i.e., a higher time frame) and understand whether the price has already moved quite a distance up (or down) for the current day.
This information will help you refrain from buying (selling) if quotes have already risen (fallen) significantly. Then it is better to postpone opening a position until tomorrow. Exception: the opening of a transaction occurs in the opposite direction of the distance traveled.
Below is a real example in which the working time frame is the 15-minute chart, and the auxiliary time frame is the higher daily chart. The time period considered is 2 days. At the end of the first trading day, quotes slowed down and were unable to continue growing, although the upward trend remained relevant. This is explained by the fact that the price has already increased quite significantly (from the opening price to the closing price). You can understand this by comparing the TR of the first candle from the daily timeframe with the ATR. As a rule, when the price passes 70% or more of the ATR, transactions in the direction of the trend are not recommended.
The example described above can be compared to a car and the amount of gasoline in the gas tank. If the price has passed its average (or close to it) TR value for a specific time interval, then the gas “runs out” and it will be difficult to continue further movement in the same direction. Only about 10-20% of candles have a TR that is twice or more the average ATR.
Trading Rules
The general rules for making transactions using oscillator signals are given in the table:
We looked at basic indicators and technical analysis models.
The next step towards successful trading is drawing up your own trading system that takes into account the features of your trading strategy, assessing its effectiveness and developing risk management rules.
Investment 101 has a course on creating trading systems - Algorithmic trading in financial markets.
Indicators and oscillators in the Forex market
In this material we will help you understand the essence of technical instruments that are used in the Forex market. All of them are divided into two types - indicators and oscillators. Let us immediately note that traders (especially beginners) often make a factual error or substitution of concepts when they also classify oscillators as indicators, which is fundamentally wrong. The only similarity between these categories of technical instruments is the template design, with which you can track the history of the dynamics of a currency pair on its chart.
It is worth remembering that information about the currency chart is provided differently by these two types of technical tools, so constantly take this into account in your work.
Thus, the trend of a currency pair (the concept of movement in the market - down or up) that has the best significance for the success of a transaction can be determined using indicators.
Moving average indicators are considered one of the brightest representatives of this category of technical tools. In their work, they allocate a certain period of time for which the average price of a currency pair is calculated. Thanks to this, it is easy to determine the direction of the trend by having a currency chart relative to the average price. An uptrend is detected when the chart is above the average, a downtrend when it is below. This operating principle is fundamental to all indicators.
The next stage after establishing the trend of a currency pair is to correctly determine your entry into the market. This is an extremely important point, avoiding mistakes in which will eliminate the possible drawdown of your own deposit by entering the correction zone.
And it is at this moment that you should use an oscillator. He will be an ideal assistant in eliminating possible losses. It also makes it easy to set rollback sizes. As an example, we will give the so-called stochastic (or stochastic installation). Using it, you can set the level of movement reversal, which helps you make the right decision about the moment to enter the market. Stochastic accomplishes this task by showing oversold and overbought zones. The vast majority of oscillators function in a similar way.
In conclusion, we can conclude that using both indicators and oscillators in conjunction, you can get excellent results in determining the ideal moment to start a trading operation.
Currencyhistory.ru
We advise on the topic:
- Leverage – benefits and risks
- Forex trading: advantages and disadvantages
- The danger of gambling when trading on the foreign exchange market
Volume Oscillator
January 15, 2020 Dmitry Vysotsky
Volume Oscillator
The “Volume Oscillator” indicator is the difference between two MAs of the transaction volume for an instrument, expressed as a percentage.
The difference between two volume MAs with different period lengths can be used to determine the direction of movement of the main volume trend (increase or decrease). An increase in the “Volume Oscillator” above zero means that the short-term volume MA is above the long-term one, i.e. that the short-term volume trend is higher than the long-term trend.
Calculation:
VO = (MA(Nshort, VOLUME) – MA(Nlong, VOLUME) ) / MA(Nlong, VOLUME) * 100,
where MA(N, VOLUME) is the moving average of VOLUME for N periods,
Nshort – short period value,
Nlong – long period value.
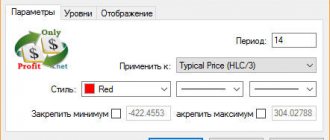
Setting options:
“Short period” – Nshort period value for the first (“short”) MA, default = 5, “Long period” – Nlong period value for the second (“long”) MA, default = 10, “Method” – MA calculation method (Simple, Exponential, Vol.Adjusted), default is “Exponential”.
In a number of terminals, in addition to the VO oscillator curve, a signal line is calculated, which is constructed by smoothing the VO moving average. This produces the MACD based on volumes. However, in the classic version, in which the indicator is presented in the QUIK terminal, the oscillator looks like a regular VO curve, fluctuating in a separate window.
The main idea of the oscillator is to track the dominant trend in changes in trading volume. When the fast moving average is higher than the slow moving average, the oscillator stays above zero, showing an upward trend in volume. If the oscillator is below zero, this means that the moving averages have swapped places and the volume is falling.
There are a large number of interpretations of changes in trends in volumes and their correlation with price dynamics. In the classical sense, if the volume grows during a price movement, then the direction of this movement is the price trend. For example: if the price rises and the volume grows, and the opposite situation occurs when the price falls, this means that the majority of players are buying and the dominant trend is growth.
Accordingly, with a downward trend, the opposite situation occurs - during the falling phase, volumes increase, and in the growth phase, on the contrary, they decrease.
Setting up the indicator and trading signals In the indicator settings, you can set the periods of moving averages on the basis of which the oscillator is calculated, and the method for constructing them. It is recommended to leave the default value exponential. But it is better to make more periods, otherwise the indicator becomes too noisy. All examples presented in this article use periods of 23 and 50.
Crossing the zero line
One of the signals that can be used for trading is the oscillator crossing the zero line. A bottom-to-top intersection will be a signal to enter a trade following the trend, as volumes are increasing and the movement may continue. This signal works well if the appropriate settings are selected.
Divergence
Another reference point for trading can be the classic divergence signal for oscillators. Bearish divergence occurs when the price reaches a new low and the local low on the oscillator is higher than the previous one. Conversely, a bullish divergence occurs when price makes a new high and the oscillator high is lower than the previous one. Such a signal is a harbinger of a trend reversal and should be expected after a long, measured movement. After sharp price jumps, divergence, on the contrary, is ineffective.
Level breakdown by indicator
Also, the indicator can give signals to exit consolidation a little earlier than it becomes visible on the price chart. In such cases, the oscillator curve crosses its levels, showing a significant change in volumes.
Like many indicators, the volume oscillator can be used in conjunction with other analysis tools. Using it in trading, you can increase the efficiency and profitability of your trading system.
OSCILLATORS
Oscillators characterize the speed at which data series move. These versatility indicators are used to describe the rate of change in price, turnover, sentiment, fundamental economic indicators or any combination of variables. Some of the most popular price oscillators include the stochastic oscillator, relative strength index (RSI), and moving average ratios and differences (see Price Oscillators: Moving Average Oscillators). Typically, they are based on data covering a period of one to four weeks; however, oscillators can be adjusted to any time horizon.Most often, the oscillator oscillates around a horizontal level - the median, which serves as an “anchor” and a point of attraction. Zero, one, or fifty are often chosen as such a point, depending on how the oscillator formula is structured. The midpoint marks the neutral position and is the line separating positive and negative data rate values. This point is used as a signal threshold. Note, however, that crossing with a neutral level usually gives delayed signals.
Boundary levels of maximum and minimum values can be included in the oscillator formula. Based on the study of historical data, “overbought/oversold” thresholds are also often established.
The market can only move in three directions: up, down and sideways. Most traders know that markets fluctuate within the same trading range most of the time. Lateral movements take longer than rising or falling. Within a trading range, the most profitable position is one opened in anticipation of a price reversal at one of the range boundaries. The price tends to move sharply from one extreme value to another. The strategy that allows you to get the greatest profit is briefly formulated as “buy the low, sell the high.” The trader should therefore try to sell near the upper limit of the trading range and buy near the lower limit. Oscillators are analytical tools useful for identifying extreme overbought/oversold zones.
A short-term countertrend trading strategy works well as long as prices remain within the trading range. However, as soon as a new powerful trend unexpectedly begins, those traders who played against it suffer significant losses. Profits that have accumulated over weeks and months can be wiped out within a few days.
Do you know that:
By taking 1st to 10th place in the
“Virtual Reality”
from Alpari, you can win from $70 to $500.
The prize amount is available for withdrawal without restrictions. Winners who take prize places from 11th to 30th will receive from 1000 to 10000 bonus points
.
Major trends are most powerful and dynamic at the very beginning of their development. After a price stays in a trading range for a long time, traders tend to believe that the trend has stopped. Meanwhile, during periods of new dynamic trends, oscillators quickly reach “overbought/oversold” levels and remain there while the price continues to rise or fall. The appearance of divergences means a slowdown in the initial rapid speed of the new trend. Oscillator traders continue to buck the trend, and subsequent loss taking on their positions fuels the new trend. Oscillator charts become traps of sorts, preventing traders from seeing the big picture. Counter-trend strategies based on reading oscillators have cost many leveraged players their entire fortune. Trades made against the main trend based on oscillator signals can lead to large losses in capital.
The main trend can only be identified based on long-term graphical analysis. Understanding the market from a short-term oscillator is like looking at the world through a microscope.
Oscillators can be interpreted in a variety of ways. Here are some of the most typical interpretation criteria:
• The values of the oscillator and/or its moving average can be correlated with certain maximum and minimum extreme values (thresholds of “overbought/oversold”), the value of which is established based on observations of the behavior of the oscillator in the past. Thus, “overbought” levels for the relative strength oscillator tend to be above 70, while “oversold” levels are below 30. This strategy is good for a market subject to minor “sideways” fluctuations, but during a strong directional trend it is ineffective.
• Relative levels of the oscillator are compared to relative levels of the raw price data so that positive or negative divergences can be detected between the two charts. Let us recall, however, that the analysis of discrepancies often suffers from subjectivity and its success largely depends on the experience and professionalism of the analyst.
• Oscillator values are compared to a neutral threshold level of 0, 50, or 100 depending on how the oscillator formula is structured.
• Oscillator values are compared with its own trend, determined by its own moving average: values above the trend mean an increase in price speed; values below the trend mean a decrease in price velocity.
• The direction of the oscillator and/or its moving average is considered: a rise is mainly associated with an increase in the rate of price growth, a fall – with its weakening.
• The trend of an oscillator is judged by its waves: a series of higher highs and higher lows indicates a bullish trend; a series of lower highs and lows indicates a bearish trend.
If one or more of these conditions are met, the trader receives an initial signal to buy or sell, which must be confirmed by analysis of the main trend.
For mixed criteria, more detailed analysis may be required. Oscillators can be a dangerous tool in the hands of a beginner, as they often involve counter-trend trading. An oscillator signal can only be considered valid if it is confirmed by long-term trend analysis. An example of using an oscillator in a long-term trading strategy is given below in the section Price Oscillators: Moving Average Oscillators. Content
| Further |