The CCI indicator was invented by Donald Lambert back in the 80s of the last century. The full name of the CCI indicator is Commodity Channel Index. CCI is an oscillating (leading) indicator. His main task is to identify “Bullish” and “Bearish”, strong and weak trends, which he (CCI) does very well. The CCI indicator can be used to search for entry points, determine trend movements, identify divergences and convergences, and can also be used as a filter in conjunction with other indicators.
Indicator settings
The CCI indicator has the following standard settings:
The period “14” means that when calculating the indicator, data is taken from the last 14 bars (candles). Changing the indicator period will affect its sensitivity: if the period is changed downwards (reduced), then the CCI will respond faster to all price changes, but more false signals will appear; if the period is increased, the sensitivity of the CCI will decrease, but the quality of the signals will increase. This is what happens if you change the period of the CCI indicator:
In the upper window (CCI red) the standard settings are set (14), in the middle window (CCI green) the period is set to “6”, in the lower window (CCI blue) the period is set to “40”. You can notice that the CCI with a shorter period (period 6) reacts to the smallest price changes, while the CCI with a longer period (period 40), on the contrary, takes into account only the largest changes. The CCI indicator itself can be used on any timeframes and assets.
CCI indicator settings
Contrary to popular belief, there are no combinations of CCI settings that would give close to 100% profit on any timeframe.
- For example, traders working on the “medium term” often use a period value equal to the number of working days in a week (5 – one week, 10 – two).
- Intraday trading requires different settings. Here you can try a histogram with a timeframe of 30 minutes and period settings with a value of 150.
Important! Intraday trading with the CCI indicator, after all, is a priority over working for long periods. It's a matter of redrawing.
The longer the period, the more time the program takes to calculate. While the indicator is waiting for the hourly candle to close, the market situation may change several times, and during this time you will miss several potentially profitable trades.
The most convenient way to download the CCI indicator is from the MetaTrader trading platform website. At the moment, you can find there a modified version of the application from 2020, adapted for binary options, with sound accompanying the advisor’s signals.
Application of the CCI indicator
The CCI indicator shows us the emergence of trend movements, or more precisely, the emergence of strong trend movements. 70-80% of the time the CCI line is between the “100” and “-100” levels - this fully reflects the fact that 70-80% of the time there are no strong price movements in the market. But as soon as a strong impulse begins, the indicator immediately shows it to us. If the CCI indicator line has broken through the “100” level from bottom to top, then there is an upward trend (upward trend), if the indicator line has broken through the “-100” level from top to bottom, then there is a downward trend (downward trend).
At the same time, the reverse intersection of the CCI line levels “100” and “-100”, i.e. returning to the standard state is a sign of the end of the impulse. In this case, the price moves in the opposite direction from the previous movement.
You can notice that the return of the CCI indicator line to the range between the levels “100” and “-100” often ends with an impulse in the opposite direction.
From this we can conclude that a breakdown of the “100” level from top to bottom (the end of an uptrend) in most cases can be considered the beginning of a new downward movement (downward trend), and a breakdown of the “-100” level from the bottom up (the end of a downward level) in most cases will be be the beginning of a new upward trend (upward trend). Simply put, it is worth buying when the “-100” or “100” levels have been broken from bottom to top, and selling when the “100” and “-100” levels have been broken from top to bottom.
Divergence
Using the CCI indicator, you can determine divergence (divergence). Divergence is a reversal signal and it looks like this:
A clear sign of divergence is the discrepancy between the readings on the chart and in the CCI indicator window. If the chart shows an increase in price, then the CCI shows a decrease in the strength of the trend. After the appearance of divergence, the trend turns to downward, which can be seen in this screenshot.
Using the CCI indicator with other indicators
CCI indicator and RSI indicator
The CCI indicator perfectly complements other indicators. For example, it can be combined with an indicator such as RSI:
In this combination, it is worth considering only the moments when the CCI returns to the range between the levels of “100” and “-100”. But with this combination of indicators, it is possible to determine the moments of further continuation of the trend.
In this situation, we can observe a clear downward trend, this is told to us not only by the chart itself, but also by the location of the RSI line - it is mainly below the “50” level. Accordingly, we will only be interested in downside entries. All points at which you can enter are indicated by red arrows. These points are determined by the following parameters:
- There is a clear downward trend.
- The RSI indicator line is below the “50” level, but is not in the oversold zone (below the “30” level).
According to the identified signals from the CCI indicator, all signals can be used when the indicator line breaks the “100” and “-100” levels from top to bottom.
CCI indicator and Bollinger Bands
The combination of CCI and Bollinger Bands indicators is also very interesting.
Here it is worth considering the moments when the price returns to the Bollinger Bands channel and also returns to the range from “100” to “-100” on the CCI indicator.
CCI indicator
CCI ( English Commodity Channel Index ) appeared as a result of the analysis of commodity and commodity markets as a tool illustrating the cyclical nature of the processes occurring in them.
The indicator's author, Donald Lambert, described the CCI in 1980 in his work “Commodity Channel Index: Tools for Trading Cyclical Trends” (article published in Commodities magazine). It outlines the ideas for working with the indicator:
- The market develops cyclically (the maximum necessarily gives way to the minimum and vice versa, and the period of the cycle can be measured).
- Deviations of prices from the average obey statistical laws.
- A statistical deviation greater than the average indicates an increase in the probability of changing the direction of movement.
Since the found patterns are valid for all financial instruments, the CCI indicator has found its application only in commodity and raw materials, but also in the stock and foreign exchange markets (Forex). Today, the tool is included as standard in most trading platforms, including MetaTrader.
Figure 1 – CCI indicator
The indicator is built in a separate window and looks like a classic price oscillator line. The main movement is carried out in the active zone around the axial (zero) line. Its boundaries (the boundaries of overbought/oversold areas) are established based on chart analysis (characteristic values +100/-100).
Unlike classic oscillators, Commodity Channel Index has no restrictions, reaching values up to +300/-300 and higher (depending on settings). In addition to the traditional overbought/oversold zones, there are “special” areas on the chart, located, as a rule, behind the +200/-200 levels.
Characteristics
The CCI indicator has received recognition from traders and analysts due to its characteristics:
- versatility – working with the tool is possible on any markets, financial assets, time frames, sessions;
- functionality – interpretation of Commodity Channel Index readings allows you to identify market trends and moments of their change, and receive several types of trading signals;
- Possibility of use with other technical analysis tools.
At the same time, users note a significant advantage of CCI, since a differential (difference) calculation algorithm is used; the indicator signals are certainly ahead of the price chart. This advantage is used in the TS, for example, to receive a trading signal when the support/resistance line on the indicator chart is broken, which occurs earlier in advance of a similar event on the price chart.
The Commodity Channel Index has common disadvantages of differential indicators (oscillators). The most significant is sensitivity to price movements, including market noise. To eliminate it, it is recommended to work with higher timeframes (from H1 and higher) or use additional technical tools to filter false signals.
Read more: Currency Power Meter - information indicator of currency potential
Calculation
The properties of the Commodity Channel Index are determined by the calculation methodology used by the author.
- Calculation is carried out at typical prices (Typical price):
Pt = (High + Low + Close )/3.
- A simple moving average is calculated for the price Pt with a given period N:
MA = SMA (Pt, N).
- The deviation of the price from the MA value at each interval is calculated:
D = Pt – MA .
- The normal deviation is determined:
The CCI value is calculated:
k = reduction factor, used to normalize the Commodity Channel Index values to ensure they are within the specified range. The author empirically determined the value k = 0.015. Some traders and analysts are trying to optimize the ratio, but currently there are no known successful attempts to use other k values for the indicator.
The calculated ratios reveal the probabilistic (statistical) meaning of the CCI - in fact, the graph reflects the normal distribution of price deviation from the moving average. In this case, the amount of dispersion in the classical formula determines the boundaries of the active zone and overbought/oversold areas.
- About 70% (more precisely, 68.2%) of all deviations fall within the range from -1 to 1 (from -100 to 100).
- 27.2% of the values lie in the areas -100..-200 and 100...200 – overbought/oversold zones.
- With a probability of 4.2%, deviations fall into the ranges of -200..-300 and 200..300 - “special” overbought/oversold areas.
- Exceeding the levels -300 and 300 occurs with a probability of 0.1%.
Based on such data, it is easy to formulate some trading rules. For example, due to the low probability of long-term presence of deviations in “special” overbought/oversold zones, the CCI chart exceeding the corresponding levels becomes a signal for searching for moments of price reversal.
Settings
Figure 2 – Forex Trader
In the Commodity Channel Index settings, the main role is played by the period for calculating the moving average (normal deviation) N.
Since CCI is designed to visualize market cycles, the accuracy of this parameter selection affects the reliability of the indicator readings.
The author suggests using 1/3 of the cycle duration as a standard value, determined by analyzing a price chart or other technical tools.
For the calculation, adjacent highs or lows on the price chart are selected, the number of bars between them is determined, and the resulting result is divided by 3. To increase accuracy, it is recommended to collect statistics on historical data.
Another calculation option is to use known time dependencies for the selected asset. For example, when working on the derivatives market (futures), where the most significant interval is 1 month (30 days), the optimal choice would be N=10.
It should be remembered that as the calculation period decreases, the sensitivity of the CCI to market noise increases significantly, and as it increases, the volatility of the indicator and, accordingly, the number of generated signals decreases. In the latter case, the number of false entries is reduced, but more often a situation arises when a signal about the beginning of a strong price impulse is not given by the instrument’s chart.
Thus, to configure the Commodity Channel Index, it is necessary to take into account:
- instrument volatility;
- selected trading period (timeframe);
- rules of the strategy used.
Thus, for the Forex market, when trading on major currency pairs in the H1-D1 intervals, profitable trading is carried out when choosing a period of N=20. For long-term trading, it is worth trying a settlement period of 60 or more. The basis for intraday trading will be the CCI with a standard period of 14.
Installation
In most trading platforms, the Commodity Channel Index is included in the list of standard instruments. The MataTrader terminal was no exception. No indicator installation required. The trader only needs to attach the CCI to the chart and set the settings:
Read more: Laguerre indicator - digital filter for market cycle analysis
Figure 3 – Settings options
- Select the “Oscillators” tab in the navigator window.
- Double-click on the indicator name, or right-click and select “Attach to Chart” in the context menu that opens, or drag the indicator to the chart area.
- In the settings dialog menu, set the CCI parameters – calculation period and price series.
Depending on the chosen strategy, on the “Levels” tab, a display of the required levels is added, usually 0, -100, +100, -200, +200.
Advantages and disadvantages of the CCI indicator
The CCI indicator is an excellent, multifunctional indicator that allows you to get a lot of useful information about the current price movement. It perfectly complements other technical indicators and is part of many profitable trading strategies. In addition, this is a classic indicator, which means that it can be found and used on the trading platforms of the following binary options brokers: Binomo, ExpertOption. The disadvantages of the indicator include its slight lag, as well as a relatively large number of false signals when trading only using the CCI indicator. Conclusion - filters are needed to increase the accuracy of the signals of this indicator.
Compatibility with other indicators
The Commodity Channel Index interacts well with almost all technical analysis tools, which opens up prospects for building profitable trading systems. CCI is most often used in combination with:
- Moving averages. Moving averages are used both on the price chart - as a trend indicator, dynamic resistance support line, false signal filter, and on the indicator chart. The latter option, among other functions, generates additional trading signals, for example, when the indicator line crosses the moving average.
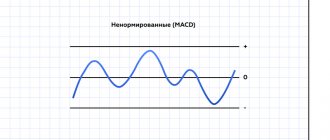
- MACD or classic oscillators, such as Stochastic. Working together allows you to receive reliable signals (for example, when duplicated on different charts), and use some of the characteristic points for entering the market and closing positions.
Read more: How to use the Keltner Channel indicator?
CCI is practically not used in conjunction with Momentum and its derivatives - the algorithms for calculating indicators and the behavior of indicators are similar, which leads to simple duplication of most signals.