Hello, fellow Forex traders! Many of you have probably come across a mention of a trading technique called “Wolfe Waves” online. Some information businessmen are trying to sell courses based on it, although there is nothing complicated or secret in this approach to trading strategy. And today we will look at what these waves are, how to find them on a chart, and most importantly, how to use them in trading to make a profit.
Wolfe waves in Forex
What are Wolfe Waves?
According to Elliot, the market has a wave structure and is subject to certain pendulum movements. Many other researchers agree with him and some of them have developed their own wave theories. One of them is Wolfe Waves.
From the Forex for Dummies Course we remember several reversal and continuation patterns. These figures are quite subjective. There are not so many rules for their construction. It is often remarkable for beginners to see these figures where there are none at all.
Wolfe waves are a reversal pattern that follows very strict rules. According to the author of this article, this pattern is the most accurate and least subjective reversal pattern. The success rate for practicing this figure is very high. Studying Wolfe Waves is definitely not for beginners and you should start mastering this trading strategy after about a year of trading. This pattern is found on almost all timeframes and works on all instruments.
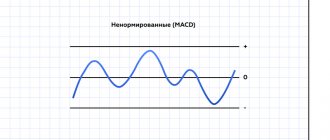
According to Newtonian mechanics, every action has its reaction. The Wolfe Wave trading system was developed based on this statement. The price, like a pendulum, swings from side to side: up and down. And her movements are not as chaotic as they might seem at first glance. Today we will learn to see the almost invisible. What other traders miss.
Let's pay attention to the picture below. This is the Bullish Wolfe Pattern . All waves in this pattern are numbered, they are all important and each wave has its own specific function.
Bullish pattern rules:
- Point 1 is the first of three model definition points;
- Wave 1-2 is the basic foundation of the model. The whole model is a continuation of it;
- Point 2 is the first top of the swing price movement. Must be above point 1;
- Point 3 is the second of three model definition points. Is the minimum reached after waves 1-2. Must be on the chart below point 1;
- Wave 3-4 is the second wave in our pattern;
- Point 4 is the maximum of the second wave of our pattern. Must be below the second and above the third point;
- Point 5 is the third of the model definition points. Is the minimum reached after wave 3-4. Located on a line drawn from point 1 to point 3. must be below the third point. This is our entry point.
It is upon its achievement that the pattern is considered acceptable for starting trading ; - Points 1-3-5 are on the same line;
- Point 6 is our goal. It is located on a line drawn from point 1 to point 4. Upon reaching point 6, all positions are closed and the pattern is considered completed
; - Wave 5-6 is the strongest and only traded Wolfe wave;
- Points 1-4-6 are on the same line.
Bearish Wolfe pattern
Bearish pattern rules:
- Point 1 is the first of three model definition points;
- Wave 1-2 is the basic foundation of the model. The whole model is a continuation of it;
- Point 2 is the first top of the swing price movement. Must be below point 1;
- Point 3 is the second of three model definition points. Is the maximum reached after wave 1-2. Must be on the chart above point 1;
- Wave 3-4 is the second wave in our pattern;
- Point 4 is the minimum of the second wave of our pattern. Must be above the second and below the third point;
- Point 5 is the third of the model definition points. Is the maximum reached after wave 3-4. Located on a line drawn from point 1 to point 3. must be above the third point. This is our entry point.
It is upon its achievement that the pattern is considered acceptable for starting trading ; - Points 1-3-5 are on the same line;
- Point 6 is our goal. It is located on a line drawn from point 1 to point 4. Upon reaching point 6, all positions are closed and the pattern is considered completed
; - Wave 5-6 is the strongest and only traded Wolfe wave;
- Points 1-4-6 are on the same line.
These rules describe Wolfe's ideal patterns. Such situations arise quite rarely and in reality, as usual, there are some nuances. Let's look at them:
How to build Wulf waves
Among the main advantages of Wolfe waves as a trading pattern is a clear description of the structure and formulation of the rules for constructing a figure on a chart, including for special cases.
Bullish Wolfe Wave
When building a bullish pattern, you should adhere to the following rules:
Figure 7 – Bullish Wolfe Wave
- Work begins from point 2 – local maximum. It is desirable, but not necessary, to exceed the level of the previous similar extremum (maximum).
- On both sides of vertex 2, significant local minima are marked - points 1 and 3. A mandatory condition is that 3 is located below vertex 1. Edge 1-2 forms the base of the figure.
- Through 1 and 3, a trend line is built - one of the boundaries of a converging triangle (wedge).
- Behind top 3, the next local maximum is marked – point 4. For a valid pattern, top 4 is located above point 1, but below 2.
- From point 1 through vertex 4 a forecast line (EPA Line) is constructed.
- The next low, point 5, is formed at the intersection of the declining price wave from point 4 and trend line 1-3. The location of top 5 on line 1-3 is not necessary, but the condition must be met - point 5 is below 3. The formation of a “five” serves as a signal for entry.
- As a result, an upward movement is predicted from turning point 5 to the intersection with the forecast line 1-4. The intersection is the final peak of pattern 6. After its formation, the pattern is considered complete, and open trades are closed.
Violation of any of the above conditions cancels the formation of a Wulf wave. Most indicators complete patterns that are not valid, but the likelihood of them working out is much lower than in the case of correct patterns.
Bearish Wolfe Wave
A bearish Wolfe wave is the mirror image of a bullish pattern:
Read more: What is Pips in Forex and trading and how is it calculated?
Figure 8 – Bearish Wolfe Wave
- Point 2 is a local minimum.
- The adjacent maximum 3 is higher than the first maximum 1.
- One of the boundaries of the wedge is trend line 1-3.
- The next local minimum 4 is located above top 1 below 2.
- The forecast line (EPA Line) is drawn through 1 and 4.
- Top 5 is a local maximum formed by a rising price in the area of trend line 1 – 3 (above point 3, not necessarily on the line). The formation of point 5 is a signal to sell the asset.
- A downward movement from top 5 is predicted until it intersects with line 1-4. When crossing, the final top of the pattern is formed.
After the final formation of the wave, open trades are closed.
For both bullish and bearish models, the validity of the pattern and the forecast should be considered only after the formation of a local extremum at point 4 and a confident price movement towards trend line 1-3.
Features of the fourth wave
Among the features of Wolfe waves, problems are noted during the formation of point 4. Its essence lies in the shape of a correctional wave after movement from top 3. Its beginning can be a plane with several local extrema or a triangle, including several small waves.
Figure 8 – Features of the construction of 4 points
As a result, it becomes impossible to unambiguously determine the position of vertex 4. Consequently, there is no problem with drawing the forecast line 1-4 and determining the final goal of the movement.
If such a situation arises, the trader is recommended to mark all possible alternative options for point 4 and draw a forecast line through each of them. As a result, a beam of rays is obtained that can be used to partially close orders or move StopLoss.
Features of the fifth wave
When wave 5 is formed, its location in the area of trend line 1-3 is not necessary. The only condition is the presence of a price turning point.
The figure shows 2 variants of marking in which the wave did not reach the support line (alternative lines are shown with dotted lines, the peaks are marked with the alt prefix). Even despite the significant distance from 5 to line 1-3, in the alternative version there is a high-quality development of the forecast.
Figure 9 – Features of wave 5
There is also the opposite situation - point 5 goes beyond the line 1-3. This marking also does not negate the validity of the pattern, and if a vertex falls into the SweetZone, it even increases its predictive value.
Sweet area in Wolf's waves
Sweet Zone (Sweet Zone) – a special area of pattern marking. It is formed between the trend line 1-3 and the line of the equidistant channel drawn parallel to 2-4 through point 3.
Figure 10 – Sweet Zone
The presence of a zone indicates the formation of a triangle (converging wedge) in the structure of the model, which is one of the signs of the reference pattern. The beginning of the wave (finding top 5) in the SweetZone indicates a high reliability of the forecast and a likely strong movement.
Nuances that arise when working with the fourth point
Often, at the moment the fourth point is formed, the market may be flat or the price draws a triangle; in the resulting jumble of vertices, it is quite difficult to find the true fourth point. We find ourselves in a difficult situation and are not sure: which of the lines drawn from point 1 to point 4 will be the true target line for the formation of point 6. Let's take them all into account. Yes, yes, you heard right. Now we have a lot of 6 points.
Let's pay attention to the bearish pattern in the picture above. As we can see from this schematic image, ultimately all points 6 lying on line 1-4 were worked out, but this might not have happened. We need to calculate our lot in such a way that at each point of contact between lines 1-4 we close it a little if we are not sure of the final goal. Alternatively, we can move the stop loss after passing each line 1-4. Upon reaching point 6, all positions are closed. Further movement may continue, or it may rebound. The probability of these events is 50%. You should never ignore the rule of exiting at the last 6th point.
Stop Loss and Take Profit for Wolfe Waves
In such a situation, how can you determine where to place the stop loss and the target level? The stop loss level for the Wolfe Wave is set below the intersection of line 1-3 and line 2-4, the price may fall to this level and the author himself marks the area below the “neck line” as a sweet zone, but is it worth sitting out losses. To determine goals, we build a vertical line at the intersection of lines 1-3 and lines 2-4, and look where this vertical line intersects line 1-4 - in this place you can navigate by the goals of the Wolfe Wave model. Moreover, the vertical line will show the estimated time to achieve the goal.
If the lines do not intersect and do not make it possible to determine the stop loss and take profit, then you can look for small models or, if the Wolfe Wave is directed towards the trend, simply buy from the “neck line” with a close stop. As an example, the marking of the Wolfe Wave on the eur/jpy currency pair is presented.
Tasty zones in the Wolfe pattern
In order to start moving from point 5 to point 6, we need to gain liquidity. In this connection, sometimes point 5 is below the line 1-3 or often spikes it. The zone located below the 5th point, lying on the line 1-3, is called the sweet zone . Entering trades in this zone is considered the most profitable.
It is quite simple to outline the boundaries of this zone. It is necessary to draw an auxiliary line between vertices 2 and 4. Duplicate this line strictly parallel and move it to point 3. If the line built from point 2 to point 4 is parallel to the line built through points 1-3, there is no tasty zone.
If the angle constructed from point 3 of our supposed point 5 in the tasty zone is too wide relative to the line 1-3, then most likely you did something wrong and this is not a Wolfe Wave pattern at all.
Rules for trading on Wolfe waves - strategy
The trading algorithm when working in Wolfe waves includes:
- Model identification at the formation stage;
- Determining the moment to enter the market;
- Calculation in accordance with the obtained parameters of the pattern of movement targets and loss limitation levels.
Read more: What are fractals: definition and practical application in Forex
The pattern is identified after the formation of the first 4 points of the figure.
Rice. 11 – Building a strategy based on Wolfe waves
If the requirements are met for all elements of the structure (tops and edges), the trader looks for options for entry (aggressive - immediately after the formation of a local extremum) or conservative - with a pending order.
After opening a trade, the StopLoss level is determined - several points beyond the top level 5.
Nuances of entering a position
Options for entering the market may depend on the formation of point 5.
- If beam 4-5 crosses trend line 1-3 and point 5 is in the SweetZone or outside it, a trader who has chosen an aggressive trading style can enter on the reverse breakout of trend line 1-3. The conservative style involves entering after retesting 1-3 pending BuyStop or SellStop orders, placed several points from the local extreme that formed after the breakout.
- When 5 is formed on the trend line 1-3 or without its intersection by ray 4 - 5, an entry is made through the market upon confirmation of the formation of top 5.
For the second option, the optimal method for making a trading decision is to receive additional signal confirmation, for example, if there are 5 reversal candlestick formations at a point or a signal from technical indicators.
The nuances of exiting a position
In an ideal Wolfe wave, a forecast line (EPA Line) is constructed to determine the closing price of a position, etc. “point of arrival” (ETA), which predicts the closing time of the transaction. This point is the virtual vertex of a converging triangle (wedge) formed by lines 1-3 and 2-4.
In the reference pattern, the time of formation of top 6 (price intersection with the EPA Line) coincides with the ETA.
Hence, there are several options for closing trades using Wolfe waves:
- Price crossing the EPA forecast line (the most common, but the least profitable - with a strong movement, most of it is lost).
- Closing by time – when leaving the ETA time point.
- TakeProfit order . Installation level is the intersection of the vertical line passing through the ETA and EPA Line.
Rice.
12 – Closing a transaction with a TakeProfit order A combined method is possible, combining several of the above. An example is an exit based on the first of the events: when the price crosses the EPA or when the ETA time expires.
How to trade based on the Wolfe wave?
A variant of marking the Wolfe wave on a real chart with currents for making trading decisions is shown in the figure. Shown are conservative and aggressive entries, placing a StopLoss order, closing when the price crosses the EPA Line.
Figure 13 – Examples of using Wulf waves
Wolf and other patterns
The structure of the Wolfe wave almost completely coincides with the “Three Indians” price pattern. As a result, the signals generated by the models are mutually amplified.
Five of the six points of the wave may well be included in separate harmonic patterns (anti patterns and alternative options should be considered). In this case, mutual amplification of the generated signals is also observed and the task of calculating movement targets is simplified.
The model interacts well with combinations of Japanese candlesticks and PriceAction patterns. In this case, reversal signals serve as confirmation of the formation of the tops of the figure and allow early entries without losing part of the movement.
Thus, Wolfe waves are a reversal formation with a precisely defined structure. Strict rules are used for identification; as the shape approaches the reference one, the reliability of the forecast increases. Using the model allows you to determine with a high degree of accuracy the moment of entry into the market and the goals of further movement. The method works on any markets, assets, timeframes.
Let's look at some examples in practice
Let's try to detect the Wolfe pattern on the EUR/USD pair (H1). From the picture below we can observe that there are 3 points on the same line. These are points 1-3-5. We suspect a Wolfe pattern. We try to draw it according to all the rules of the “ bearish pattern ”. Where is our goal? Our goal is determined by a line going from point 1 to point 4.
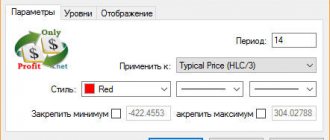
We cannot know where and when the price will touch this line. Therefore, we will establish a ray from this straight line going to infinity. And for this we will implement a small algorithm of actions. By right-clicking on our line, select “Properties”, then “Options”, and “Beam”.
We are waiting for the pattern to be worked out. There is a price touch. This was indeed Wolfe's pattern. Excellent result. Let's calculate our profit.
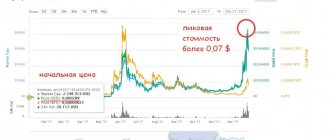
Next, let's try to find our pattern using the example of gold GOLD (M15)
In this chart we can see a clearly growing bullish trend. The chart looks a little chaotic and not very beautiful, although it fits our standard rules for constructing a bullish pattern. Let's go through them:
- 2 below 1;
- 3 above 1;
- 4 between 3 and 2;
- 5 above 3.
We predict a downward movement by making a sell trade at point 5. The price tests line 1 again. Perhaps this is some kind of mistake, but as we remember, sometimes the Wolfe pattern forms “ Sweet zones ” . We find it by laying a (blue) line from 2 to 4. Next, we copy it to point 3. We definitely have a gap for the tasty zone. Let's see what happens next.
Slowly, a price reversal began to occur. Will the price really go that far down since we are in an upward trend?
We see where the (conditional) trend breakdown occurred. Next, we may observe a false signal of a price reversal, but despite this, we remain in the transaction and wait for the pattern to be fully worked out. Yes, the pattern has worked out and we can take profits, breathing a sigh of relief. The duration of the transaction was 2 trading days.
What about commodities, CFD contracts and other assets? The same. Wolfe works everywhere. Let's look at the example of Brent oil BRN (H1).
We build a pattern according to all the rules and make a sell transaction while waiting for the pattern to work out.
We wait for the touch. We close the deal. Let's count the profits :)
Conclusion
Despite the fact that the Wolfe pattern is a rather difficult figure to perceive, requiring long-term training to detect, it is one of the most effective tools for wave technical analysis. The potential from using this pattern will exceed all your expectations and assumptions about its use. Despite the seeming impossibility of forming such a complex figure on the chart, it forms very, very often and is also one of the most profitable.
Forum thread
Best regards, Alexey Vergunov TradeLikeaPro.ru