What is a stock order book?
An exchange order book or order book is a list of limit orders that are registered on the exchange. Orders are compiled in a table and differ in color:
- sell orders (Ask) – highlighted in red;
- buy orders (Bid) – highlighted in green.
Collectively, such orders are called offers from the English word Offers (price offer).
The difference between the best Ask order and the best Bid order is the spread.
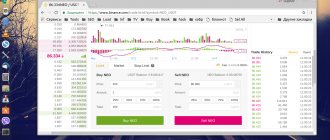
An example of a market order book on a cryptocurrency exchange
In addition to the one shown in the example, the order book may have the following display options, which depend on the software used:
- a table in which Ask orders are located at the top and Bid orders at the bottom;
- graphic display in the form of a histogram;
- diagrams and more.
What is a stock order book: features and structure
Stock exchange quotes change every second. This is influenced by many factors, but the main thing is the balance between supply and demand. Trading volumes are so huge that it will be difficult for a novice investor to analyze them without auxiliary tools. This is precisely why the market glass or, in other words, the market glass was invented.
An exchange order book is a list of orders to buy and sell online for a specific trading asset. It contains prices that market participants offer, which is a kind of indicator of the mood of the stock market. Orders to sell (ask prices) are displayed in red at the top, and purchase orders (bid) are displayed below in green. You can find many definitions of this instrument on the Internet - order book, Level2, etc. By the way, it is the second name that is used in the American stock market.
Unlike a quote chart, the order book does not provide a visual representation of the price of an asset. It shows the number of orders for purchase and sale, which will further influence pricing.
Any market is an auction where two parties participate - the buyer and the seller. For example, you want to sell 5 units of a product at a certain price that you set yourself. For the transaction to be completed, you need a buyer who agrees to purchase these goods at your price. If she doesn’t suit him, he will look for another offer. But if he doesn’t find it, he will be forced to purchase the goods at your cost. This is how transactions happen in the market; there are many of them every second.
I also recommend reading:
How to close an IIS and is it worth doing it ahead of schedule?
Pitfalls when closing an IIS: what you need to know
Visualization of the stock order book may differ depending on the broker's trading terminal. In other words, everyone is free to draw such a table in their own way, adding their own elements and tools for market analysis to it. For example, there is a sparse order book that includes a histogram. It clearly displays trading volumes, making market analysis and perception easier for novice traders and investors. But the general structure remains unchanged.
In the classic representation, the stock order book has two columns. The first indicates the purchase/sale price of the asset, and the second indicates the number of lots (units) that market participants are willing to buy/sell. None of the order books offered by brokers can reflect all orders submitted online. Only those that most closely reflect the actual cost of the product are indicated. This is called market depth. If it is designated as 20X20, then the window will indicate the 20 best buy prices and 20 best sell prices. Most brokers offer a stock book with these parameters. But they can be changed individually in the terminal settings.
What orders are displayed in the order book?
There are several types of orders on a cryptocurrency exchange, but not all of them end up in the order book. Let's look at the three most common types of orders on crypto exchanges:
- Market order – instantly opens a trade at the current price. Such orders do not go into the order book, but are displayed in the deal feed.
- A limit order is a sale or purchase transaction that opens only when the price of an asset reaches the value specified by the trader. Limit orders are immediately entered into the order book.
- A conditional order is an application that assumes the occurrence of certain conditions in the market, after which either a market order will be opened, which will appear in the transaction feed, or a limit order, which will be displayed in the order book.
If limit orders of several traders contain the same price, then they are displayed in one line in the order book and are executed in order.
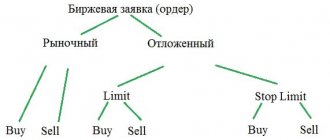
Types of exchange orders in the order book and their features
All exchange orders are divided into three categories:
- Market - formed at the lowest and most favorable cost per unit of goods;
- Limit – include not only the cost, but also the volume of applications;
- Conditional – require the fulfillment of conditions other than those established in limit orders.
Only limit orders are visible in the order book. Completed transactions are not visible here, because they are executed instantly as soon as the price suits the buyer. Conditional ones are not shown here because specified conditions must be met before they become either market or limit. The latter will end up in the stock order book.
I also recommend reading:
How to participate in an IPO through brokers: instructions for beginners
How to invest in an IPO as a Russian investor
All orders in the table are divided into three categories based on the volume of contracts for a specific asset:
- small (up to 100 contracts) - such orders are not of interest to investors and other market participants, since they are not capable of influencing the market;
- medium (up to 1000 contacts) – can affect the price, but only if the density of such orders is in a narrow range;
- large (up to 10,000 contacts) - these are the orders that traders are interested in, since they are price determining.
There is another classification of applications:
- aggressive – orders that serve as the “engine” of the market. They arise suddenly and are capable of pushing prices towards a certain trend;
- Passive – provide some protection for the price of an asset. They do not move or change, representing a certain pricing base.
Traders mainly use prices based on passive orders to place pending stop-loss orders. But the active ones are already used to make a profit.
What is a deal feed?
All orders executed on the exchange are included in the transaction feed, where the time and price of order execution are indicated. Buy transactions are marked in green, sell transactions are marked in red.
In addition, the deal feed contains information about the volume of each deal. Such a record is called a “ print ”.
Example of a deal feed
The deal feed is used to analyze activity and sentiment on the stock exchange:
- if the asset’s transaction tape has reduced activity, then such an asset is low-liquid;
- if purchases predominate in the feed, then bulls predominate in the asset; if sales, then bears predominate.
Which exchange players fill the order book?
Naturally, the order book is filled by traders, however, there are differences between traders and traders, therefore, for a more effective analysis of the order book, you need to understand what types of players take part in its formation.
- Major players
As a rule, these are investors who have fairly large amounts of assets on their balance sheets. Large players can cause major changes in the price of an asset. Their identification, as well as an understanding of their goals, is the main task of analyzing the stock market. This is not very easy to do - often large investors split large volumes into several smaller orders, which can be seen when analyzing the transaction feed.
- Mid-market traders and investors
This is the largest audience of cryptocurrency exchanges. They trade using their own tactics and strategies. This category is most susceptible to panic, and their behavior is easy to predict. Average traders and investors can be identified by the volume of their transactions and the frequency of placing orders.
- Market makers
This category of players, by placing orders, maintains the liquidity of certain assets in the market and also reduces the size of the spread. This is beneficial, first of all, for the cryptocurrency exchanges themselves, as well as for issuers of cryptocurrencies and tokens with low liquidity.
Such activity is quite risky, therefore, in their work, market makers use special algorithms to set two-sided quotes. Crypto exchanges reward market makers with preferential commission rates, which gives them the opportunity to make transactions in different directions.
- Scalpers
This category includes traders and trading robots who open a significant number of trades during an exchange session with a short lifetime. This category of exchange players makes profits as a result of trading within the spread.
It roughly looks like this: after analyzing the order book, the scalper places an order with the best Bid price and, almost together with it, an Ask order. If the moment is calculated correctly, the profit from the transaction will significantly exceed the commission amount.
Another option is possible. An order with a large volume has appeared in the order book. Often, such orders are not executed immediately. The scalper sees such an order and opens a deal in the hope that after such a large order is executed, the stop losses of those traders who bet on a price rebound will be closed. It is on the acceleration of the price after stop losses are triggered that scalpers try to make their profit.
- High frequency trading robots
Due to the almost instantaneous execution, orders of high-frequency robots are quite difficult to notice in the order book, but they are clearly visible in the transaction feed. Robots work using special algorithms and are characterized by a very high speed of calculations.
Analysis of the stock market: what a trader should pay attention to
Understanding the depth of market is a good tool not only for analyzing the market and its sentiment, but also for making a profit. The trader will be able to understand when it is better to open a trade in order to get the maximum benefit from the market and price changes.
Unlike classical technical analysis tools, which study the market based on price history and for this reason are lagging, the order book is a leading tool.
Experienced traders and stock speculators recommend using it as an auxiliary tool. For example, by identifying key support and resistance levels on the chart, the order book will help determine the likelihood of a breakout and price rebound from them. To do this, you just need to look at the number of orders in the table at a price close to the target level.
I also recommend reading:
New ETF funds FXWO and FXRW – what FINEX offers investors
Unexpected reshuffling of Finex funds: what you need to know
When analyzing the depth of the stock market, you need to pay attention to the following factors:
- the end of a calm market state, which is usually called “flat” (flat), is usually characterized by the appearance of a large order;
- The largest volumes of orders in the order book form support or resistance levels. Traders use them to determine stop loss levels;
- prices in the order book sometimes clearly reflect the boundaries of the channel. Resistance from above is characterized by a large number of sell orders near a specific level. This means that traders will try to actively buy the asset at prices below resistance. Having touched this level, the price will most likely bounce down, triggering a trend reversal to the downside;
- The order book helps determine a correction against the main trend. For example, the chart shows an upward trend, but in the table the number of sellers is much larger. This means the completion of the correction, after which the price will again begin to move towards its trend. Traders use this opportunity to take into account the trend and get maximum profit.
How to analyze players' orders in the order book and the deal feed
As we said above , the main task of analyzing the order book is to identify major players . It is necessary to pay attention to transactions with large volumes in the order book. They will give an understanding of in which direction a major player can move the price of an asset. Orders with large volumes are called " wall ".
At the same time, you should always keep in mind that a large player is not always behind a large volume in the order book - if orders from several traders are placed at the same price, then they are displayed in one line.
If, after analyzing orders in the order book, you find a wall, then pay attention to where it is located.
If the wall is located approximately at the maximum or minimum values of the day, then this level can be marked as the zone where most players plan to close their trades, which means that a price reversal will follow.
If the wall is located near a resistance or support level, you need to understand that the price most likely will not overcome it, so the area behind the wall is optimal for placing a stop loss order.
If a large order is placed by just one large player, then you need to be prepared for the fact that as soon as the price approaches such a wall, the player can cancel his order and the wall will disappear. In this case, the price will not be restrained by anything, and it will easily reach the stop losses set behind such a wall.
Large players, masquerading as average investors, can split their deals into several parts. This phenomenon is called an iceberg, the visible part of which is in the order book. The underwater part of this iceberg is displayed in the deal feed. It looks something like this:
- There is always a large order in the order book at a certain price. As soon as this order is executed, the same order immediately appears in the order book - this is the visible part of our iceberg.
- The underwater part of such an iceberg will be visible in the transaction feed, as many executed orders at the same price.
If, when analyzing the order book and the tape of transactions, you notice an iceberg, then you need to understand that you are observing a large player who is breaking his wall into several orders in order to maintain the price of the asset at a certain level.