In order for Forex trading to be profitable, it is necessary to study and deeply understand the market and the forces that have the greatest impact on it. Trading volumes have a huge impact. Most often, the risk of losses increases when market makers appear on the market (this is the name of large participants who have a great influence on the development of events). Despite the proven strategies and experience of traders, there is always a risk of losing funds during transactions.
The influence of market makers on changes in price trends is very large, since the operations they carry out are characterized by a huge scale.
What is generally considered to be market volume on Forex? This is the number of trading transactions that occurred over a selected period of time. When conducting trading operations, it is necessary to take into account the total value of trading operations, volume analysis data, and the location of opening and closing points.
Why do you need market volume analysis?
Using volume analyses, it is possible to see how active the “money of professionals” is, which significantly influences Forex. Using volume data analysis, you can follow the largest participants and understand exactly what the current trends are in the market.
There are the following types of volumes:
- Quantitative – calculated through the amount of transactions carried out during a given time period. Using this type of volume, you can see how transactions are distributed according to the price level inside the candle.
- Exchange - calculated based on the number of shares sold.
- Tick volume – depends on the speed at which prices change. Although there are differences from the actual volume level, the error is quite low.
Cluster volume analysis
I think that for many traders it is absolutely not clear why the candle moves exactly this way and not otherwise, and why, for example, after a bullish candle a stable bearish candle suddenly appears or vice versa. Unlike standard chart types (bar or candlestick charts), the cluster chart type allows you to look inside the chart element.
In the example below, we see a cluster chart, where each element displays the trading volume at each price for a specific period of time (in our example, the half-hour time frame M30). The maximum volume of the cluster is highlighted in red, which can both turn the market around and stimulate the current movement. So, in the middle cluster we see that this is a bullish candle (on the left edge of the cluster there is a green stripe between the opening (O) and closing prices (C)). The maximum cluster volume is 10,707 lots at a price of 102,850, which moves the price higher. The next cluster opens at the same price, however, at the price level of 103050 we see large volumes for sale, the largest of which is 9,159 lots, which reverses the price. This cluster is already closing in bearish status (red bar on the left side of the cluster) at a price of 102650, and we see a trend reversal.
Differences between tick and market volume in Forex
Trading using tick instruments is used to analyze price jumps. Through changes in the price of a currency pair, you can trace changes in the real volumes of assets on Forex. A broker can provide detailed information about tick volume using a trading terminal for MT4 (this is a Forex trading platform that analyzes trading markets using trading advisors).
Built-in volume indicators are designed to display histograms alongside price charts. Do not underestimate the importance of volume indicators, as they provide the opportunity to make a comprehensive Forex analysis.
How is Market Profile applied in practice?
Now let's figure out how to put the market profile into practice.
First of all, it is worth noting that the market profile makes it possible to see the true trend in the movement of value areas . If the price does not return to the area of previous days, then there is a strong and clearly defined trend.
If the areas of value overlap each other, then we can say that there is no clear trend at the moment.
Gaps in poorly traded areas, areas where there is only one letter, as well as gaps, are closed.
If there is no trend, then most likely one letter will close at the end of the day, or within 1-2 days. At this moment, the market tries to restore balance. Therefore, it is possible to develop tactics aimed at working with this aspect of the market profile.
If you see one letter and at the same time do not observe a clearly expressed trend, then you can count on the fact that this letter will close in the opposite movement.
The boundaries of value areas are very often used as support and resistance levels based on the market profile. As a rule, this tactic is used when value areas fluctuate within a range formed after a strong movement.
To put it simply, areas of value overlap each other, and a strong price movement acts as a mother candle.
In general, we are seeing an inner bar pattern, with the outer bar highlighted by a more extended value area and the next two candles located inside it.
You can work for a breakout or rebound from value areas. The technique is the same as when working with Price Action when trading breakouts and rebounds of levels. The only difference is that we determine the levels based on the boundaries of the value areas of the mother candles:
Also, the boundaries of value areas can be used to set stop losses.
If we were considering some positions to sell, then it would be logical to set a stop loss just above the border of the upper value area:
In my opinion, one of the most valuable uses of a market profile is trading in flats, or more precisely, understanding when a flat has ended.
Let's imagine that there are several days when there is a flat. Let's assume that the designated day has not yet arrived:
We can construct the boundaries of this area according to areas of value. Not by the tails of the candles, but by the areas of value.
Remember that technical analysis is an art, not an exact science, so we set the values approximately to form a picture of what is happening:
At these boundaries, we can easily work for a breakout. When a breakout occurs, we understand that, in general, the flat is over, and we can make money on it.
I would like to add that this application of the market profile is fully justified.
What difficulties exist in determining market volumes?
The decentralization of the market makes it impossible to obtain accurate information about volumes. It’s good that for trading using VSA there is enough data on relative volumes; more precisely, you need to know what it will be like in comparison with other candles.
To build trading strategies using volumes, you need to use the volumes obtained by analyzing data from the futures market or tick volumes. Tick volume is determined using the amount of price change over a selected period of time. A tick means a price change of one point. There will be a minimal error between real and tick volumes, therefore, in the absence of data on real volumes, tick ones are used.
A futures is a contract for the purchase and sale of an asset during the conclusion of which the price and delivery time are agreed upon. Futures can be understood as a type of deferred agreement used in an organized market with mutual settlements within the exchange. Currency futures, through analysis of trading volumes, give an idea of what is happening now on the spot market and this data can be used to analyze the situation on Forex.
The main rules when trading using volumes:
- Most often, volumes help to notice reversals and significant market movements and outpace price increases.
- It is necessary to estimate volumes based on the latest charts.
- Volumes most often increase with rising prices; large volume corresponds to a large candle. If you deviate from the norm, you should expect a trend reversal.
Aggregate volume analysis
As mentioned above: for a successful forecast it is necessary to use vertical, horizontal and cluster analysis together. Let's look at an example on a cluster chart of futures for the RTS index on the half-hour timeframe (M30) in the Volfix terminal.
Vertical volume analysis
We described above that especially strong movements occur when vertical volumes change. On the chart we see that when comparing volumes at the close of trading on Friday from 23:30 to 23:59, low volumes were observed, and when opening trading on Monday from 10:00 to 10:30, volumes increased almost 10 times. Moreover, unlike forex terminals, exchange platforms have more advanced functionality for volume analysis. In this example, we have set the display of vertical volume for buying (21,795) and selling (25,504), and as we see, there is a significant imbalance that should lead to an exit from the flat and a downward trend.
Horizontal volume analysis
The chart shows that at the price level of 102150 there is a maximum level of horizontal volume of 132,859 lots. This suggests that this level is extremely interesting for traders: both at the moment and in the recent past. This level can be regarded as a significant resistance level, and, therefore, a downward rebound in price can be expected.
Cluster volume analysis
Within the cluster, at the opening of trading, we see large volumes above the opening price, with maximum volume at the price of 102100. This indicates that there is high pressure from the bears. In addition, large volumes are accumulated near a significant horizontal volume resistance level.
Conclusion
In this market situation, we see the combination of all three dimensions of volume analysis, which clearly indicate a decline in the market. Each dimension complements and confirms the other. The vertical histogram signals increased volumes + the advantage of sellers; the vertical histogram indicates the resistance level; and cluster analysis confirms the increase in volumes within the cluster, giving the exact location of entry into the market.
This is what this market situation looks like on a bar chart, which is more familiar to most traders.
What are volume indicators?
The number of ticks and their ratio to the price range of the candle are determined by volume indicators. Let's take a closer look at them.
Better Volume indicator. Refers to vertical volume indicators. It automatically evaluates the candle spread and volume, comparing the received data with the previous ones. Using special signals, it shows the spread volume.
There are also horizontal volume indicators, their purpose is that they show the level of interest in all price levels for the selected period. This analysis helps make finding support and resistance levels much easier.
Volumetric and profile market analysis
Is everything new well forgotten old? Not always, and not about the Forex market. You can, of course, drive a vintage car at a speed of 20 km/h, or you can have a rare car in your collection and drive a modern car of the 21st century. The same applies to Forex market analysis tools: either Fibonacci levels (1202) and Gann lines (1923), or direct information from the CME futures market in Chicago. Why from futures? Because the charts of currency futures are identical to the charts of the corresponding currency pairs, and the CME exchange in Chicago has the largest open interest in options and futures contracts among other world exchanges.
Let's get acquainted with advanced analysis tools:
- vertical volume;
- volume profile (horizontal volume).
Unlike the indicators built into MT4, which have a mathematical basis and follow the market, the vertical (ClusterDelta_Volume) and profile volume (ClusterDelta_VolumeProfile) scripts provide exchange information based on actual current trading volumes. Scripts are supplied by the stock analytical portal Clusterdelta and are paid.
The volume profile can be configured for different time intervals: quarter, week, day, hour or a specific session. It is not redrawn in time and always shows real information that took place on the CME exchange in Chicago at one time or another.
The vertical volume script displays the total volume of each candle on the selected timeframe. It carries information about the number of past contracts at a given time. For example, if there was a very large candle, but few real contracts passed, then there was simply some news here, and the price will soon return to its main direction. On the contrary, a large number of past contracts in a candle indicates a focused market mood.
To use these scripts correctly, you need to know their roots. Let's start with the fact that the scripts were created for futures, and therefore we will build on them. Futures are traded from contract to contract and have expiration dates (the end of the contract). The lifespan of a currency futures contract is quarterly. Thus, there are 4 contracts per year: December, March, June and September. The contract expires approximately in the middle of each of the designated months. Each contract has a so-called core - the maximum accumulation of orders or the most traded level. Graphically, this looks like a strong level where the price has stood for a long time. The core changes with the change of contract, in rare cases it remains at the same level. The core is formed within approximately 2/3 of the time of the time frame selected for construction. If the price goes above the core of the contract, then buy transactions are considered, if it trades below, mainly sell. The core of the contract acts as the strongest support/resistance level and retains its strength even after changing the contract. On the graph, the core is indicated in red.
In addition to the core of the contract, the volume profile shows significant support and resistance levels where there was good interest from players. The more volumes were traded, the longer the histogram bar will be and the more significant the level.
The expiration (end) date of the contract carries valuable information, as it is characterized by large bursts of volatility, as some of the positions are closed by large players and funds are transferred to a new contract. Knowing this, you can be prepared for anti-trend movements. By applying these scripts and futures information to currency pairs, you can significantly improve the efficiency of Forex trading.
The relationship between volumes and prices on the market.
How to read volumes and apply the knowledge gained in your strategies? The most common situations are the following (we will use the vertical volume indicator):
- If prices rise and volumes fall, it is most likely that the market is moving by inertia and market makers consider the price to be unreasonably high. This situation will most likely lead to a change in trend or a sharp pullback.
- When volumes increase after breaking through an important level, the price will most likely continue to rise.
- If there is a large volume on a small candle, the market maker is most likely gaining a position and a sharp rise in price is likely. Take your time and try to determine who the big player is: a bull or a bear. There is a high probability of a trend reversal.
- With a sharp increase in volumes in an established market, one can expect a likely trend reversal and panic among speculators.
A large volume is formed over a certain period of time. On the graph, this section is usually reflected in the form of a range. It is known that the American session is the most active, but here is the schedule of Forex trading sessions. It is during its operation that the largest number of transactions occur, which as a result is manifested by the largest trading volumes. Therefore, when searching for price levels, first of all, you should analyze the volumes of transactions concluded during the American session.
After reading the article, I recommend that you familiarize yourself with the huge arsenal of volume indicators and support and resistance lines, these are the ones you will need most!
Vertical market volume
Vertical volume analysis is designed to show net volume for each time period. If we take a classic bar chart, then each column of the vertical volume histogram displays the total volume for each bar/candlestick. In other words, this is a display of volume for the period of time during which the price was formed.
The vertical volume indicator in the MetaTrader4 terminal window, where the “Value: 5024” parameter indicates that 5024 lots were traded during the time period from 04:00 to 05:00 on November 9th. However, it is worth remembering that the indicator can only show volumes within the ECN network in which it is located or the volumes of the Prime broker.
However, it is NOT RECOMMENDED to pay attention to the parameters of standard indicators of the Forex terminal. For most Forex brokers, data on real volumes is hidden and does not have unknown calculation algorithms. In simple terms: the volumes of the Forex kitchen are taken from the head.
The only thing you can pay attention to is the visual size and movement of the volume histogram columns, which duplicate volumes from real exchange sites.
Let's look at an example:
Let’s say a market maker plans to make money on a rapid upward trend. To do this, during a downward trend, MM places a limit order with a large volume below the current price. Using the VWAP algorithm, the market maker acts as the opposite side of trades for those wishing to sell, placing buy orders on the market in such a way as to continue the smooth downward movement of the price. Small traders continue to sell in the hope that the price will maintain a bearish trend. Thus, when a limit order with a large volume to buy is reached and executed, the pressure from the “bears” dries up, since everyone who could have already entered the market. Large volume pushes the price up, knocking out Stop Loss orders from a crowd of sellers, which have the nature of Buy orders in this case. Consequently, a large volume of new “buys” pushes the price even higher, knocking out more and more stop orders, which in turn move the market even further.
The majority of traders (including those who “caught moose” selling), noticing a strong trend, begin to enter the market to buy, which in turn also moves the price up.
According to the law of classical supply and demand, if there is demand (D1) for purchase, but there is no supply (S1) for sale, then the price (P) will rise until the required volume (Q) appears.
The price moves up until supply and demand reach an equilibrium point at point E, that is, the next strong resistance in the form of new volume. At the equilibrium point, the “ flat ” begins again, and starts over again. It is according to this principle that charts of trading instruments move in price corridors.
In general, using vertical volume analysis, you can successfully predict the market, but it is also worth using horizontal and cluster analysis.
What is called volume in Forex?
In fact, the volume of concluded contracts shows the number of trading operations with options and futures contracts that were completed over a certain period of time. In other words, it can be expressed like this. Volume is the amount of money that has passed through the market per unit of time.
What does this give to a trader? First, you need to remember what the quote rate depends on, and their values are controlled by a constant balance between supply and demand. A simple and objective relationship is observed here - the greater the demand, the higher the price. And, conversely, if supply grows against the backdrop of weakening demand, then the value of the asset will inevitably fall.
Accordingly, when analyzing a particular instrument, it is necessary to take into account the volumes of purchases and sales formed over a certain period. As a result, volumetric analysis of the Forex market is a very important forecasting tool when trading in financial markets, since it is with the help of volumes that one can determine the market’s interest in certain price levels. At the moment, the volume is neutral, so you always need to wait for an abnormal surge, which will indicate the path for further price movement.
Delta cluster
A third-party service that allows you to look at a chart presented in the form of clusters - a kind of candlesticks, only in it each price corresponds to a cell with a specified difference in volume. A sharp increase in this value indicates that there is great interest from sellers or buyers , which can at least slow down the movement. Unfortunately, this effective volumetric analysis tool is only available for a fee , free only with a time delay. Also, real data on the number of contracts and volumes can be obtained on the website of the Chicago Mercantile Exchange, however, they will relate to trading in futures for a currency pair. Such data are not very representative, but to some extent they can provide guidance.
In general, it is worth noting that there are quite a lot of traders who are skeptical about volumetric analysis due to the fact that the Forex market is fragmented; when we looked at its structure, we saw that there are many separate pools that together create an interbank space with other participants. Therefore, data obtained from one pool cannot be considered as a picture of the entire market.
Read further - Fundamental analysis of the Forex market
Let's remember the old truth: a whale always swims against the current that carries plankton. A correct analysis of trading volumes will allow a trader to assess the situation on the market, understand where he is at the moment, and adjust his position in the most profitable direction. To swim not towards the whale, but next to it.
We still dare to remind the reader that price movement is caused precisely by a shift in the supply/demand balance. On Forex, due to its global decentralization, there are no and cannot be real trading volumes , so for analysis, so to speak, some of its analogues are used in the hope that they accurately reflect the real dynamics.
Analysis of trading volumes as confirmation of the main trend was proposed by Charles Dow in his famous theory. No matter how the classic theory tries to convince us that “price takes everything into account,” the market is still ruled by volume, that is, the amount of money that each participant brought to the market. If you want a specific price, back up your interest with money.
A few basic concepts
Trading volume is the number of contracts (shares, transactions) concluded during a certain trading period.
The following volumes are distinguished in the financial market:
- tick – dynamics of price changes over the period;
- quantitative - number of transactions during the trading period (count);
- exchange (or net) - the number of contracts traded at a certain price during the trading period (Volume).
For analysis, it is the last indicator that is most valuable, since it shows the interest recorded by the market in a specific price or range.
To analyze trading volumes, a Forex trader is not interested in exact data, only their relative value, that is, large-medium-small, and, if possible, its qualitative composition: sellers-buyers, “big money”-hedgers-speculators. The volumetric analysis carried out should show the moments of the appearance of any “abnormal” phenomena on the market: for large players (appearance and exit), imbalance of sellers/buyers, preponderance of hedgers over speculators, determine the “market mood” and guide the trader after the leaders.
So, let's start with the most available data:
Tick volume analysis
The tick volume available in MT4(5) is only the number of price ticks per unit of time, that is, the total number of purchases and sales. One vertical column of the indicator shows the total volume that passed on a given candle/bar. It doesn’t even take into account the fact that the price can change by only 1 point and this has no effect on the overall dynamics. In addition, the result also depends on the quote filtering settings on a specific broker.
The use of the popular tick volume indicator Volume (Better Volume, BW MFI – as an option) can be viewed here https://dewinforex.com/ru/torgovye-strategii/vsegda-v-trende-ili-tochnaia-strategiia-na-tikovykh-ob -emakh.html?mobile=true.
Tick volume simply records the fact of the presence of some activity at the current price and its dynamics can only be assessed in relation to neighboring ticks - more, less, or deviation from the average value for the period. The entry of a newcomer on a price account and a large player with a million lot in terms of tick volume are absolutely equal operations, but the real impact on the market for these operations differs significantly.
What benefits can you get from tick volume in Forex?
- If the tick volume indicator (the height of the column on the indicator) grows, you can most likely expect a breakthrough, since this means an increase in activity at this price level. No tick indicator will show which direction the breakout will go with sufficient accuracy; you need to use additional tools
- If in a calm market there is a sharp change in price for 1 tick, that is, after a period of market silence (columns of the same height), there is a sharp jerk (up/down), in the next column a little back, then again a slight increase: with sufficient probability we can assume that in a few minutes there will be a directional movement for 5-10, because the number of transactions is accumulating and volumes (real) are increasing. Therefore, it is important to assess the overall situation over a period of 5 to 15 minutes. If the market is non-directional, but volatile, then such signals are generally lost in the general “noise”.
Sometimes fans of technical analysis manage to trade well on tick assets - more or less stable methods are here https://dewinforex.com/ru/torgovye-strategii/torguem-tikovyi-ob-em-proverennye-torgovye-strategii.html
But the main problem when analyzing tick volume is the lack of information about the direction of the transaction . It is impossible to determine from tick histograms which operations prevailed in the market at the calculated moment - purchases or sales. It also does not take into account the presence of open interest - that is, already open positions that support the current trend. Therefore, making decisions about opening (closing) positions based solely on tick volume is, to put it mildly, not reasonable.
Analysis of trading volumes at price levels
The analysis of vertical tick volumes can be supplemented with information about horizontal volumes – that is, the number of contracts at a specific price level. For this purpose, a separate class of indicators is used and it looks something like this:
Horizontal volume shows the level of interest at a certain price and if it coincides with the activity on the tick chart, then we get a fairly reliable entry point:
The combination of indicators looks something like this:
Option Level Analysis
For skeptics who believe that such a method does not apply to the analysis of trading volumes, let us remind you that the derivatives exchange market forex is in great demand precisely by large capital, using currency options as, at a minimum, a medium-term risk hedging tool. Moreover, both types of assets are popular among those trading on US exchanges: trading in currency futures and trading in options on these currency futures.
Having up-to-date information on the results of currency options trading can make transactions in the spot market more reliable. The main source of such information is the Chicago Mercantile Exchange (CME). A regular review is published every Monday for the most liquid currency pairs in terms of option positions: EUR, GBP, JPY, CAD (as of Friday). Let's recall the basic definitions:
More information about the option levels indicator can be found here https://dewinforex.com/ru/indikatory-foreks/indikatory-optcionnykh-urovnei-stupeni-vashego-uspekha.html.
Options are written and closed every month, but only a small number of these options are exercised; virtually all of them are either withdrawn from the market or closed early. This suggests that options sellers (as a rule, large banks work in options) calculate their risks well.
CME trading information is published every day and is freely available. Of interest is the ratio of volumes for put options to buy options (options call) and, preferably, in dynamics. The gradation follows three ranges: (0.5-0.8) – growth, (0.8 – 1.2) – range, (1.2-1.5) – currency decline. If on the reporting date it has a value of 0.6 and the dynamics of the indicator tends to decrease, then buying a currency on Forex will look preferable. If the result is a value of 1.4 with an overall growth trend, then it is better to sell the spot currency. If there is a small volume of options for the current month, then we do not use this ratio.
Option price levels represent the strike (option exercise) levels at which the maximum number of positions is open. They are considered reliable support/resistance levels because they are protected by options sellers, that is, by large participants. An approximate type of information on options:
If a large participant, for example, sold a large option to buy EUR at 1.0800 and if the price of EUR on the spot market goes up to this level, then he goes to Forex with the sale of EUR so that the price does not pass the level of 1.0800 before closing the option, otherwise he will be at a loss. That is, the option strike price level will act as resistance. That's why:
- Option levels for a large purchase can be considered strong resistance levels; you can trade for a rebound from the level, but if the level is broken, then there is a high probability that the breakout will be false (or weak).
- Sell option levels can act as support. Bidding tactics are similar.
The strongest levels are considered to be for quarterly options. It is recommended to combine such analysis with studying the position report for traditional exchange-traded currency futures.
Analysis of trading volumes according to CME Group reports
Why CME? The decentralization of the Forex market and the lack of accurate data on volumes force us to look for trading platforms whose dynamics most accurately reflect global movements. It is quite logical that the world's largest companies in the financial sector operate in the United States, including CME Group, the operator of the world's largest commodity exchange, created as a result of the merger of the Chicago and New York Mercantile Exchanges.
Today, the volume of transactions on the CME is about 15 million contracts per day, which in monetary terms exceeds 5.8 trillion. dollars per year Trading volumes also continue to grow due to competent management to include large market makers in its network to increase liquidity, including for exotic trading assets. The share of electronic trading in total CME volume has already reached 92%, since the company closed the famous “trading pit” in July 2020 and announced a complete transition to electronic trading.
For many years, CME has been a leader in foreign exchange transactions, including the physical delivery of assets. All CME trading contracts are recorded in one place and directly affect global pricing. Of course, it is also advisable not to exclude trading volumes on European and Asian exchanges from the analysis, but it is exchange trading on the CME that most accurately correlates with the overall dynamics of the main assets.
All current CME stock reports are freely available on the company's official website.
We follow the indicated scheme and get to the current data page, where we can see weekly data on the traded volume and data on changes in open interest. The Contract Specifications tab contains all the technical data of the futures asset.
To find the final data for the selected currency futures for the previous day, look for the Market Data Services option and select Daily Bulletin. Next, we look for the required asset in the list. Lazy people can simply download the entire report in an archive from a file server, and then select the reports they need.
A standard report looks like this:
The general methodology for analyzing option levels for this report can be found here https://dewinforex.com/ru/indikatory-foreks/indikatory-optcionnykh-urovnei-stupeni-vashego-uspekha.html, so we will additionally note only the data for analyzing open interest.
Market profile analysis
The concept of market profile emerged from Peter Stidlmeier's application of the bell curve to the analysis of price dynamics. Allows you to determine how close your current position is to the optimal market position. More details: https://dewinforex.com/ru/indikatory-foreks/indikator-market-profile-glavnyi-rynochnyi-mekhanizm.html, and market profile indicators for the exchange trading platform - here https://dewinforex.com/ru/ indikatory-foreks/indikatory-dlia-thinkorswim.html
Cluster volume analysis
This is a relatively new direction, because until 2004, information on horizontal volumes at price levels was generally not available to ordinary traders. The main tool selected is a market profile showing the levels:
- accumulation or accumulation of volumes at obvious price levels - after them the main trend begins;
- distribution or unloading of volumes - a reversal (or correction) begins after fixing the volumes.
The point trading volume is determined for each period and the volume delta is calculated.
Cluster breakdown of volumes by prices and delta readings show reliable information about the behavior of volume at strong levels and the current market imbalance (in the direction of purchases or sales). It is the delta that allows you to determine not only the starting point of the basic movement, but also its direction.
Cluster analysis of trading volumes allows you to accurately determine entry points both long-term and intraday, the only problem is obtaining the data. Today, special software has been developed that allows you to evaluate not only the formation of volumes, but also the delta between buy/sell orders (within bars), for example, paid MarketDelta, Volfix and others, from free ones - ClusterDelta (https://clusterdelta.com/platform# download). Current volume data is downloaded from an external file and is regularly updated, of course - only exchange assets. If you are not ready to open a real trading account on the CME or NYSE, then you can only receive such information on a paid basis.
Analysis based on COT
Another method to find out in which direction big money is “looking”: the American CFTC (US. Commodity Futures Trading Commission), created to control and prevent violations when trading on the futures market, mandatory receives information about the actions of all major players. Summary reports of the commission (Commitments of Traders) are freely available on the official website of the organization. Of course, the American futures market does not include all market participants, but among them the majority are made up of key players. Analysis of trading volumes is based on the fact that knowing the direction of large volumes, a small player can make more informed decisions and not go against the main market.
COT reports can be found in the Market reports section of the website https://www.cftc.gov.
Scroll down to the heading CURRENT LEGACY REPORTS, then Chicago Mercantile Exchange. In the report from the second column of the table (Futures and Otions Combined) we select, for example, Short Format data. The most current report is loaded, which is published on Friday evening, but the data in it is as of Tuesday, that is, 3 days late and can only be applied with the opening of the next week.
In the report we can observe the following indicators:
In principle, you can study data directly from the report. But there are special resources where all this is much more conveniently organized. One of these resources: https://www.timingcharts.com, we will show only a general view:
As a result, we obtain information in a form convenient for analysis and consider three typical situations:
Situation 1. August 24, 2020. Reduction of the Chinese discount rate. The level of open interest is growing, hedgers are declining slightly, large positions are growing cautiously. There is little money on the market, but, nevertheless, people are buying, moving with their capital to the overbought zone. It's worth waiting for a reversal. Now let’s look at situation 1 on the daily candlestick chart. On the morning of August 25, everyone began to sell, both those who were waiting for Chinese news and those who took profits.
Situation 2. After November 30, 2015, open interest drops sharply, the blue line decreases - hedgers close positions, large players maintain positions at least at the same level. It is worth waiting for the price to rise.
Let's look at a regular candlestick daily chart:
Situation 3. Neutral level without visible dynamics. The current trend is likely to continue.
Don’t forget: you can use COT reports only as an additional indicator and check the placement of players once a week before the market opens.
And as a conclusion...
Over long periods, all concepts for analyzing trading volumes work stably, but for intraday trading there are some peculiarities. In the modern market, along with the term “smart money”, the concept of “smart liquidity” has appeared. Most trading participants began to use trading automation - all kinds of robots and advisors, customized for specific trading schemes, but working with many small volumes. For what? Yes, in order to hide their true goals, the small volume is, as it were, dispersed in the area of specific levels, both in price and in time. The price picture loses clarity and forecasting becomes much more difficult.
The problem with using currency futures analysis for Forex trading is precisely the data that is analyzed - the volumes. Trading volumes on the over-the-counter market are tens of times greater than on the exchange market, and rather a strong movement on Forex significantly affects the current dynamics of currency futures, and not as is commonly believed. The fact that visually futures give an earlier reaction to the main movement can be explained by the delay in filtering stock quotes, which reach small client terminals with a delay.
We can only hope that the logic of behavior of major players (taking into account some features) in all markets is approximately the same and that all available data can be used for a more or less accurate price forecast. Source: Dewinforex
Share:
0
Social buttons for Joomla
Popular:
- 11/14/2013 06:32 | Reversal indicator - determine the end of the trend 60999
- 04/02/2015 10:04 | The VSA indicator reads the market like an open book 59263
- 09.23.2014 11:08 | The Forex advisor designer will allow you to create any trading robot 52405
- 12/13/2013 01:48 | Intraday trading - hourly Forex strategy 44136
- 12/12/2014 05:36 | Option Level Indicators - Steps to Your Success 38245
- 12/17/2014 08:56 | Market profile indicator – the main market mechanism 34210
- 09.12.2013 10:37 | Forex indicators without redrawing 33615
- 09.09.2014 10:19 | Are there profitable Forex indicators without redrawing? 32223
- 03.11.2013 07:42 | Forex strategies for daily charts 31939
- 07/09/2013 05:33 | Advisor Stelz (Stealth) 31076
- 01/16/2014 10:01 | Trader's tools - TMA 30342 indicator
- 30.08 10:51 | Potential and risks of Scandinavian forex pairs
- 23.08 10:48 | Trading strategies on RSI - current and forgotten methods
- 16.08 10:32 | Samurai strategy - an approach for the strong in spirit
- 02.08 10:53 | Dollar trading in different countries
- 26.07 10:05 | Bali system - trading with minimal effort
- 19.07 10:18 | Preemptive Strike Strategy - A Fresh Look at CCI
- 17.07 21:47 | We work using FBI technologies: a comprehensive trading strategy “Forex without risk”
- 12.07 10:24 | Trading strategies for M5 – benefits, harm and examples
- 05.07 10:58 | What indicators are used on Wall Street?
- 28.06 18:57 | Adaptive Forex indicators: new, complex, profitable, but not for everyone
Latest materials:
blog comments powered by DISQUS back to top
Finding the best time frame
There is no single ideal timeframe for any market or coin at any given time. The market is volatile. Higher time frames and ideas based on them have more value, but this does not mean that on lower time frames you will not find effective trades with a high probability of execution. It is important to check multiple time frames and evaluate trades accordingly.
Trades on smaller timeframes often have less upside or downside potential, while higher timeframes have greater upside potential. Many new traders make several trades on low time frames, rather than making fewer trades on higher time frames.
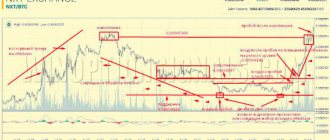
For altcoins that have recently been added to the exchange, there will be many active signals on low timeframes. For example, when $PASC was added, it had a clear chart on the 5-minute timeframe.
On the other hand, $DOGE and $LTC have clearly defined entry and exit points on weekly timeframes. This is mainly because they have been trading for a long time, compared to other altcoins. Additionally, this means that older coins move relatively slower than newly added coins. Knowing the speed of the market is critical to choosing the right time frame. When the market fluctuates heavily, a lower time frame is often more appropriate for identifying the best entry and exit points than a higher time frame.
https://www.tradingview.com/x/3bJpntAa/
https://www.tradingview.com/x/I5Vd9Rmj/