- What is a false breakout
- Types of false breakouts
- 1. Classic bull and bear traps at major levels
- 2. False consolidation breakout
- 3. Fakes (false breakout of the inside bar)
- A false breakout can cause a long-term trend reversal
- What history teaches
- About false breakouts
- Psychology of false breakouts
- Emotions Behind Bullish and Bearish Traps
- Pinbar and false breakout
- Fakes - false breakout
- Important Takeaways
When was the last time you opened a trade and the price immediately moved against you despite the fact that you were confident in your entry? And when did the price hit the stop loss and ruin the whole deal? I'm sure you encounter this on a regular basis. And not only that, I am sure that many of the readers took the opposite side of such a deal and profited from my mistakes. On the very deals that we are being “deceived”.
You see, false breakouts happen to the market all the time. This is the result of a crowd mentality where people buy at the top of a movement or sell at the bottom. As price action practitioners, we are in a great position to take advantage of these false breakouts and weaknesses in social thinking that many new traders have.
I made most of my money using controversial techniques like false breakouts and setups I developed like fakes. The power of false breakouts, fakes and extraordinary entries allows both me and many experienced traders to make money from the mistakes of others. Yes, this is a sad story, but this is how markets look - the majority here loses money, and the minority makes money on it. The very minority that has the greatest experience and knowledge. As a result, the pigs go to slaughter.
So think of false breakouts as an opportunity to make money against the crowd's delusions. Those misconceptions that force traders to enter into a trend continuation when the market is ready to turn against them.
What is a false breakout
Let's move on to the most interesting part. A false breakout is, in fact, such a market “deception”. The price tests the level, breaks it and then comes back. In other words, the market does not close beyond the level it tested. The breakout is false - it did not lead to continuation. Such false breakouts are a great way to determine the future movement of the market and we need to learn how to use them to our advantage.
A false breakout of a major market level might look like this:
At its core, a false breakout is a contradictory move that sucks out the misguided portion of the market. The goal is to wait for the price to move in one clear direction before traders are forced to close their positions on a strong reversal in the other direction. As a rule, beginners fall into such obvious traps that they enter the market immediately before it turns against the trend. These entries also often occur at major support/resistance levels or at breakouts of side channels.
The crowd mentality is such that traders only enter the market when they feel it is safest to do so. However, this is a trap, a false feeling. Trading on emotions and from emotional sensations is the reason why most traders lose money. They are deceived because the market seems so strong or very weak to them, so they think, “damn, I’ll just enter in this strong movement and ride the price.” However, the market is a wavy matter and it never follows long, even trends, ever. It returns to its mean value, which we have already discussed in previous lessons.
Therefore, we will have to use logic and counterintuitive, counterintuitive inputs to capitalize on the crowd's thinking and their delusions. Therefore, you need to maintain total discipline when trading false breakouts and pullbacks, which is why I absolutely adore them.
False breakout of the resistance level on the Forex chart (upthrust setup)
In this context, an up-thrust is a breakout of resistance, after which the price sharply returned back. The ideal setup is to abandon the level on the breakout candle or on the next candle. In this situation, traders who opened a buy deal when the level was broken are trapped. And also traders who had a sell transaction and were hoping for the price to move down, but it was closed with a stop loss.
On the chart of the GBP/USD currency pair during the month of May there was an upward trend, until the formation of a price maximum of 1.6600. In the month of June, the price forms a resistance level, which remains unbroken until 30.06, when candle A breaks the resistance level. But, as you can see, the breakout was unsuccessful, the price was unable to close above the resistance level, but reversed and a pattern appeared, which in price action is called a pin bar.
Those traders who traded a breakout of the resistance level found themselves in a losing trade. Some exited the market immediately, while others may have moved their stops. But, regardless of when the transactions were closed, they influenced the downward price movements, increasing the flow of sell orders. This is due to the fact that closing a buy transaction is a sell order.
Other traders who entered a sell trade near the resistance level, expecting a price reversal, were closed by stop loss when a false breakout (pin bar) was formed. It is known that traders most often place their stops behind resistance. And now, these traders are trapped as the price moves in the opposite direction. Some may enter sales again immediately, others will wait for confirmation. In both cases, if traders decide to open a sell trade, their orders will affect the price movement in the downward direction.
When a false breakout is visible on the chart, you need to look for an entry point into a short position along with an increasing flow of orders from those who are trapped.
Here's another example.
You can often come across the opinion that a false breakout only refers to a trend reversal. That is, a breakdown of resistance at the end of an uptrend indicates that the trend will reverse. You can think of it this way, or you can trade a false breakout as a trend continuation pattern.
In the picture above, there is also a chart of the GBP/USD pair, where candle A breaks short-term resistance, marked by a blue horizontal line. The next price move traps traders who have entered into buy trades. When such traders exit trades (closing a trade with a loss or a stop loss), the price will decrease even more.
These were examples showing a false resistance breakout. This model can also be called up-thrusts.
Types of false breakouts
Classic bull and bear traps at major levels
A bullish or bearish trap is a pattern of 1-4 candles that demonstrates a false breakout of a key level. Such false breakouts occur after a strong directional movement, when the price approaches an important market level. Most traders believe that a breakout will occur as the price approaches the level quickly and decisively. As a result, they try to trade for a breakout of the level and often the market simply “deceives” them in the form of such a trap.
A bull trap forms after the price moves upward. Traders who watch for a strong impulse are unable to resist the temptation and jump into a trade right at or above the level, because they are confident that now the price will have enough strength to confidently break through it. The market then moves slightly above the level, capturing all breakout orders and then falls after other market players push the price down, leaving our enthusiasts trapped in a long position - they wanted to go up, but it didn’t work out.
False consolidation breakout
The breakout of the trading range (consolidation) looks very similar. It is easy to fall into the trap of thinking that the corridor will be broken, and the price, instead, returns back to the range. The easiest way to avoid this situation is to simply wait until the price closes steadily outside the channel and then look for price action signals in the direction of the breakout.
3. Fakes (false breakout of the inside bar)
Fakes are one of my favorite price action setups. Studying it will greatly help you understand market dynamics. Fake is a pattern that represents a false breakout of an inside bar.
You see an inside bar and then wait for price to demonstrate a false breakout of the mother candle. We will talk about fakes in great detail in a separate lesson, so now there are just a few simple examples.
Here are two fakes, one by the way with a pinbar on a false breakout, and the second not. These are all variations of the same pattern:
A false breakout can cause a long-term trend reversal
As price action traders, we can use false breakouts to our advantage, especially from major levels. Because it is there that they often become the reason for a sharp price reversal or even a change in trend from these levels.
We need to carefully look at the tails (shadows) of the candles near the main levels. Ask yourself - how did the price generally act during the day where the candles closed? Where they closed is a major daily level and if the market fails to close higher, this could be the basis for a strong false breakout.
Often prices try to test a level and try to break through it, however, the daily candle at the close rolls back from this level and extends a long tail, thereby demonstrating a false breakout or a false test of the level. If the market was unable to close above the main level and only broke through it with a shadow, this is the basis for a strong pullback or trend change. Therefore, the closing of the candle is the most important level, especially on the daily chart, and I would focus on it.
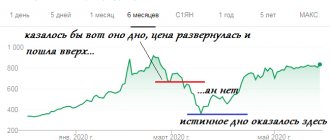
Here's a prime example to illustrate this concept. Daily chart of EURUSD and a false breakout of the main level, built on the closure of two candles, which led to a strong price reversal (I also love such entries after a false breakout, this is an excellent model, approx. Medved).
What history teaches
Here's a great example. In the week when the famous trader George Soros entered into a decline in the British pound and bankrupted the Bank of England (September 16, 1992), there was a wonderful false breakout signal on the chart. Everything is in full view - the price is trying to renew its highs and is rapidly falling down.
And this is... a classic fake setup and a great example of how price action strategies have worked for decades.
About false breakouts
If we do not learn to identify false breakouts and work with them, we will give money into the pockets of those who know how to do it. However, if you focus on the price action around the major levels on the daily chart, most false breakouts can be identified fairly easily.
If I had only one, most important piece of advice regarding your trading career, I would advise you to drop everything and start studying false breakouts and reverse trading. This will put you ahead of the 95% of traders who are stuck using common misconceptions and ineffective trading methods.
I do the opposite and try to enter trades when most retail traders are on the opposite side of the market and making mistakes. And this is almost impossible if you do not master false breakouts and fakes.
As a matter of fact, false breakouts, like the fake setup I developed, are the basis of the entire course and we will pay enough attention to them to understand them. I truly believe in this reverse trading style and have been teaching it to students for many years. Practice has proven that this approach is extremely effective. So if you choose one trading strategy, it will definitely be false breakouts and working with them.
Types of Forex traps
There are two types of Forex traps:
- Bull trap.
- Bear trap.
Let's look at each type in more detail.
Bull trap
This type of trap occurs when multiple price tops are broken in Forex, after which the trend line turns in the opposite direction.
On the graph it looks like this:
Figure 1. Example of a bull trap on a chart.
Bear trap
A price breakout of the bottom, which the price has touched many times, and after which the trend immediately changes, is considered a bear trap.
Visually it looks like this:
Figure 2. Example of a bear trap on a chart.
Now you should not have questions like, bearish or bullish Forex trap, what is it? Everything is very clear. In trading, such traps are usually called false price breakouts of support/resistance levels.
The whole point is that when a bullish or bearish trap appears on the chart, the Forex trader can profit from it without any problems. After all, these are, in fact, powerful reversal signals.
Why do such false breakouts occur? The fact is that large players, market makers, and banks usually break stop loss orders. After smaller players suffer losses, the price quickly moves in the opposite direction.
Other types of bearish and bullish traps in Forex
In trading, you may encounter the following types of bearish and bullish traps:
- Forex double top compression;
- compression in rupture;
- compression plug absorption;
- squeezing the pinbar.
Let's look at each variety in more detail.
Double Top Compression
Figure 3. Example of a bull trap on a daily chart.
This chart shows a classic situation (bull trap), when the price breaks through the resistance level and seems to be about to continue its upward movement, but then draws a needle (long shadow) and continues to move towards the downward trend, that is, this is a global trend reversal.
Compression in the gap
Figure 4. Example of compression in a fracture.
An example of a bear trap, which is shown on the chart as a compression in a gap and looks like the price continues to fall, and consolidation has appeared under the broken support level. Everything points to a downtrend, but the RSI indicator shows an extended bullish divergence, which signals an uptrend. Typically, trends change quickly, so you need to take advantage of the moment to make a profit.
Compression Plug Absorption
Figure 5. Example of compression plug absorption.
As you can see on the chart, the daily Japanese candle beats the box, and everything points to further growth, but after a while it gives a long shadow and closes below the box. This pattern occurs quite often in Forex and you need to be prepared to take certain measures . That is, the candle collected stops and turned around.
Pinbar squeeze
Figure 6. An example of squeezing a pinbar.
This can only happen when a continuous trend ends. It would seem that the price continues its downward movement, but the RSI indicator shows divergence, which means that you need to be prepared for a price reversal, which is what we see on the chart. The candle breaks the moving average and closes behind it, you can get ready to buy.
Psychology of false breakouts
False breakouts are essentially important psychological events in which two types of traders take part - professionals who trade using logical systems and pre-thought-out patterns, and amateurs who rely on intuition and enter the market when “it seems You can come in."
It is easy to assume that the most emotional traders buy at the very top of an upward movement or at the bottom of a downward movement. Why? Because when the price gains momentum in one direction, it instantly attracts more and more traders. Gradually, the price approaches the zone where the movement ends, and traders who previously sat in the sideways movement and were bored cannot resist the temptation and jump into the locomotive. It is at this time that the market is already ready to turn in the opposite direction, since everyone is now on board and participating. At the same time, professionals have already closed transactions and made money, while amateurs are on the verge of very impressive losses (including because they like to take risks).
As a result, the market sweeps out all the amateurs who bought at the top or sold at the bottom and accelerates in the opposite direction until everyone who traded purely on emotions and “intuition” is destroyed. After this, the market is ready to restore its movement before the correction and moves further along the trend.
This is precisely the phenomenon of false breakouts. They happen when all the lovers have already jumped on the train and there are no more indifferent people left. False breakouts happen both in a trending market and at the top/bottom of the market.
Therefore, understanding the psychology behind false breakouts will help you become more aware of both price action and market dynamics.
Emotions Behind Bullish and Bearish Traps
Such traps are false breakouts at the bottom/top of the market, as we have already discussed. The market moves in one direction and then it ends in some form of false breakout. Be it a pinbar that “pierces” the level with its shadow, fakes or a less pronounced trap.
This concept is well illustrated in the EURUSD chart below. A wonderful bear trap that formed after 4 continuous days of falling prices. On the 5th day, the market broke through the support level around 1.2950, but closed higher. This is a “trap” - all amateurs decided that a 4-day price drop guarantees them a further downward movement, therefore, the support will be broken and they need to sell. Once everyone is selling, the market goes down for several days, no doubt motivating most to close around the day itself. The pros sit at higher levels and took their income or did not enter the market at all.
You see, this is a very simple thing. People who trade without a clear plan and have not mastered several simple RA setups enter, in fact, at random. Then, when they just think they can enter. As a result, they constantly buy at the top and sell at the bottom, and the market constantly moves against them, as if mocking them. We, as PA traders, can take advantage of their misconception and exploit obvious turning areas of the market, or by trading obvious trends in the simplest price patterns that reflect the emotions and unpreparedness of amateurs for the market.
The chart below shows a typical bull trap. Note that it formed after a strong move higher and a nice inside bar appeared after resistance was broken and the price closed higher. The most logical course of action in this situation is to use the inside bar that formed at the very top of the old resistance/new support around 1.3400 (those “good” inside bars on the chart).
Pinbars can also be traps. If a pinbar forms after a strong movement in one direction and hints at the possibility of a reversal, such a hint should be regarded as a trap. This is clearly visible on the chart, the very places where beginners thought they should buy. The bull trap caught the last of the bulls and the cage slammed shut.
Pinbar and false breakout
Pin bars often work as false breakouts and not necessarily as fakes. But it’s just like a candle that falsely breaks the level with its shadow (and simply doesn’t reach the breakout of the inside bar, so it’s not a fake). In the chart above, where the pinbar/false breakout is indicated, we see a pinbar that formed a false breakout around 1.3400, after which the pinbar/false breakout formed in an ascending market around a less significant support level, which is at 1.3500.
False breakouts with pin bars are a very strong price pattern and one of my favorite tools, I trade them often and recommend them to you. They can be used both in trending markets and in sideways markets.
Fakes - false breakout
A fake setup is a false breakout of an inside bar, let me remind you. For a fake to form, there must be an inside bar on the chart. It is its false breakout that makes fakes what this model is. The classic main fake is formed where the mother candle falsely breaks through. Minor fake - one of the inside bars breaks through, but not the mother candle. Such patterns should only be used on the daily chart and we will discuss them in the lesson on fakes.
The psychology of fakes is very interesting and no less interesting than bullish/bearish traps and false breakouts with pinbars. It can be explained by the conditions under which the market is formed.
If the market is trending and fakes are created, indicating work in the direction of the trend, then the reason for its formation is traders who are trying to capture the top or bottom of the market, which is not yet ready to return to the mean. In general, amateurs not only buy at the top and sell at the bottom, but they also always try to enter at the top/bottom, which does not seem very logical, but is quite understandable.
Traders who work on emotions are always the last to enter a strong movement. Either because they didn't follow their trading strategy, or they don't have one at all. They just wait until it "looks good" to enter and that's basically right before the market turns. Fakes very often form after the last amateur enters the market, and professionals push him in the other direction, which causes poorly planned positions to be closed. A similar psychology underlies false breakouts of support and resistance levels, when a fake is created after an unsuccessful breakout of the p/s.
Therefore, it is much better to wait for a real breakout and trade rollbacks to the broken level, rather than try to guess which breakout will be real and which will be false.
Fakes are also formed in trending markets when amateurs try to find its top or bottom. As a trending market stands still or consolidates for several days, many traders are confident that it will reverse and convince themselves of this, believing that a reversal is inevitable (despite the fact that there are simply no confirming RA setups).
When the market completes a short move against the trend, the professionals come in and open positions on the pullback, since this is an opportunity for them to get a good price in the direction of the uptrend and “gobble up” all the weak orders, due to which the market will return to moving in the general trend.
General conclusions from the Masterforex-V trading system - Larry Williams
- Indirectly admits that he is unable to warn IN ADVANCE when the trap of specialists (professionals) can be detected and triggered, capturing the pending orders of numerous traders.
- He does not reveal the secret of how he discovers the “specialists’ trap” using “something else” for this.
“The secret to success,” writes Larry Williams, however, is that to trade confidently, you must have something else. Something that validates the actions you are taking, otherwise you will only be predicting the price using the price. Your best trades will come from using multiple indicative analysis tools, not just price structure."
- Hints that to successfully trade these undisclosed secrets, “it is advisable to add them to your arsenal of intraday trading techniques.”
It is advisable for you very short-term traders to add these to your arsenal of intraday trading techniques. These patterns reveal excellent entry points for short-term traders. - He admits that he uses small time frames M5-30 for this.
- Prompts that “The true low of the breakout day then becomes the critical point.
If it breaks down or is taken in the next 1-3 days, there is a good chance that the breakout to the upside was a false one and traders overstocked for nothing.” It is here that Larry Williams opens trades in the opposite direction of the previous trend, recognizing the breakthrough of the technical level of the previous trend as false, and the situation as a model “a trap for specialists.”
Rice. 8. Exxon stock trend chart Fig. 9. Exxon stock trend chart
Rice. 10. Exxon stock trend chart
Tips from the Masterforex-V trading system
Rice.
11. The change in the price of GBP/USD on the chart “Specialist Trap” is a pattern that can be determined IN ADVANCE for any currency pair in the Forex market.
As an example, we can cite the materials of the educational process from the Masterforex-V Trading Academy on trading on February 2, 2007, when:
- The “specialists’ trap” 1.9737-47 (50) for the pound/dollar currency pair was predicted the evening of the previous day and confirmed a few hours BEFORE the false breakout of the previous high of 1.9737.
Questions from the Masterforex-V trading system: looking at the picture,- try to determine for yourself why the level 1.9737-47(50) was pre-defined as a “trap of specialists”, at which a reversal in the opposite direction was possible. See Masterforex-V posts '1.2.2007, 21:40' and '2.2.2007, 13:38'.
Quote (Masterforex-V @ 1.2.2007, 21:40)The main event of Friday is known to everyone 16:30 USA Number of new jobs outside of agriculture - Non-farm Payrolls January +167 thousand +160 thousand …. = 1.9737-50 trap for the pros.
Before the American session:
Quote(Masterforex-V @ 2.2.2007, 13:38)
Now, using the above method for calculating resistance and support levels, let’s consider the work plan for the session: 2nd resistance 1.9739 (1.9737 previous peak of the upward wave h4); 3rd resistance 1.9750 = could be a pro trap; 4th resistance 1.9795 (further explanation - why); 5th resistance 1.9814; 6th resistance 1.9838; 7th resistance 1.9895; 8th resistance 1.9916. The following supports: * 1.9638 (further explanation - why); * 1.9608; * 1.9578; * 1.9540; * 1.9481.
- apply the same criteria for determining the “specialist trap” to each working Forex currency pair before EVERY trading session, then not a single false breakout will be a surprise to you, on the contrary, you will be able to know exactly the points
- breaking through which the trend receives POWERFUL acceleration;
- or having rebounded from which (even with a false breakout of the previous peak as in the “specialists’ trap” model), the trend makes a reversal of at least a strong correction.
- the minimum of the pound's fall was equal to the 1st support (with an error of several points), and why this downward wave was “short” with an obligatory strong pullback;
How was the correction maximum of 1.9694 accurately determined after a rebound from 1.9838?
rice. m5 and m15
Rice. 12. GBP/USD price change on the chart
Rice. 13. GBP/USD price change on the chart
Overall, try it yourself:
- learn in advance to identify “traps for specialists”;
- turning points in the “professional trap” model (not in 1-3 days, like Larry Williams), but within just a few minutes;
- when to open “long” trades, and when to open “short” trades and their approximate end points on the session trend of that day;
- targets for a strong pullback after a “short” or “long” trade.
And so on every day before each trading session, clarifying during the session the goals of the movement and the points of its possible end and beginning of the correction, as we do at the Masterforex-V Academy before the trading session, clarifying the goals of the movement during online trading.
Part III. Wave analysis of trading: Elliott classics, problems and their solutions in the Masterforex-V trading system
Part IV. Unsolved mysteries of the classics of Forex technical analysis
Important Takeaways
What, in the end, you must understand is that you cannot trade simply on emotions, “intuition” and “it seems to go up.” You must have a clear, specific reason for entering the market, for example, an obvious price action setup or an important structural zone where several elements are combined at once.
Professional traders don't buy at the top of the market, sell at the bottom, and don't run around trying to find where the price will bounce. They do not use such strategies because they know exactly what they are looking for. They have mastered their trading strategies instead of making emotional entries. Naturally, professionals also lose money sometimes, since all traders lose in one way or another. However, the pros know how to make money from the emotional delusions of the majority, since they were able to overcome their emotional shortcomings and perceive the markets only as a logical mechanism.
This implies not only strict adherence to a trading strategy, but also the ability to resist the temptation to take too many risks or overtrade. A professional can buy in an up market or sell in a down market, but only if he sees a suitable price pattern or a good reason for doing so. And not just because “wow, the price is going up quickly, let me buy it.” They may enter at the top/bottom of the market, but only when they see a suitable anti-trend setup. And not because “oh, the price will bounce off this top, how excited I am,” although the market does not show logical zones for entry at all.
A false breakout is an emotion and it’s all about emotions. They are formed as a result of the work of traders who are guided by feelings, not logic, fantasies, not plans. Therefore, to be successful in the market, we need to trade exactly what we see, and not what we think “should” happen. This, along with effective risk management and working with senior TFs, will help achieve market success.
- Back: Pinbar
- Next: Inside Bar